Fig. 2
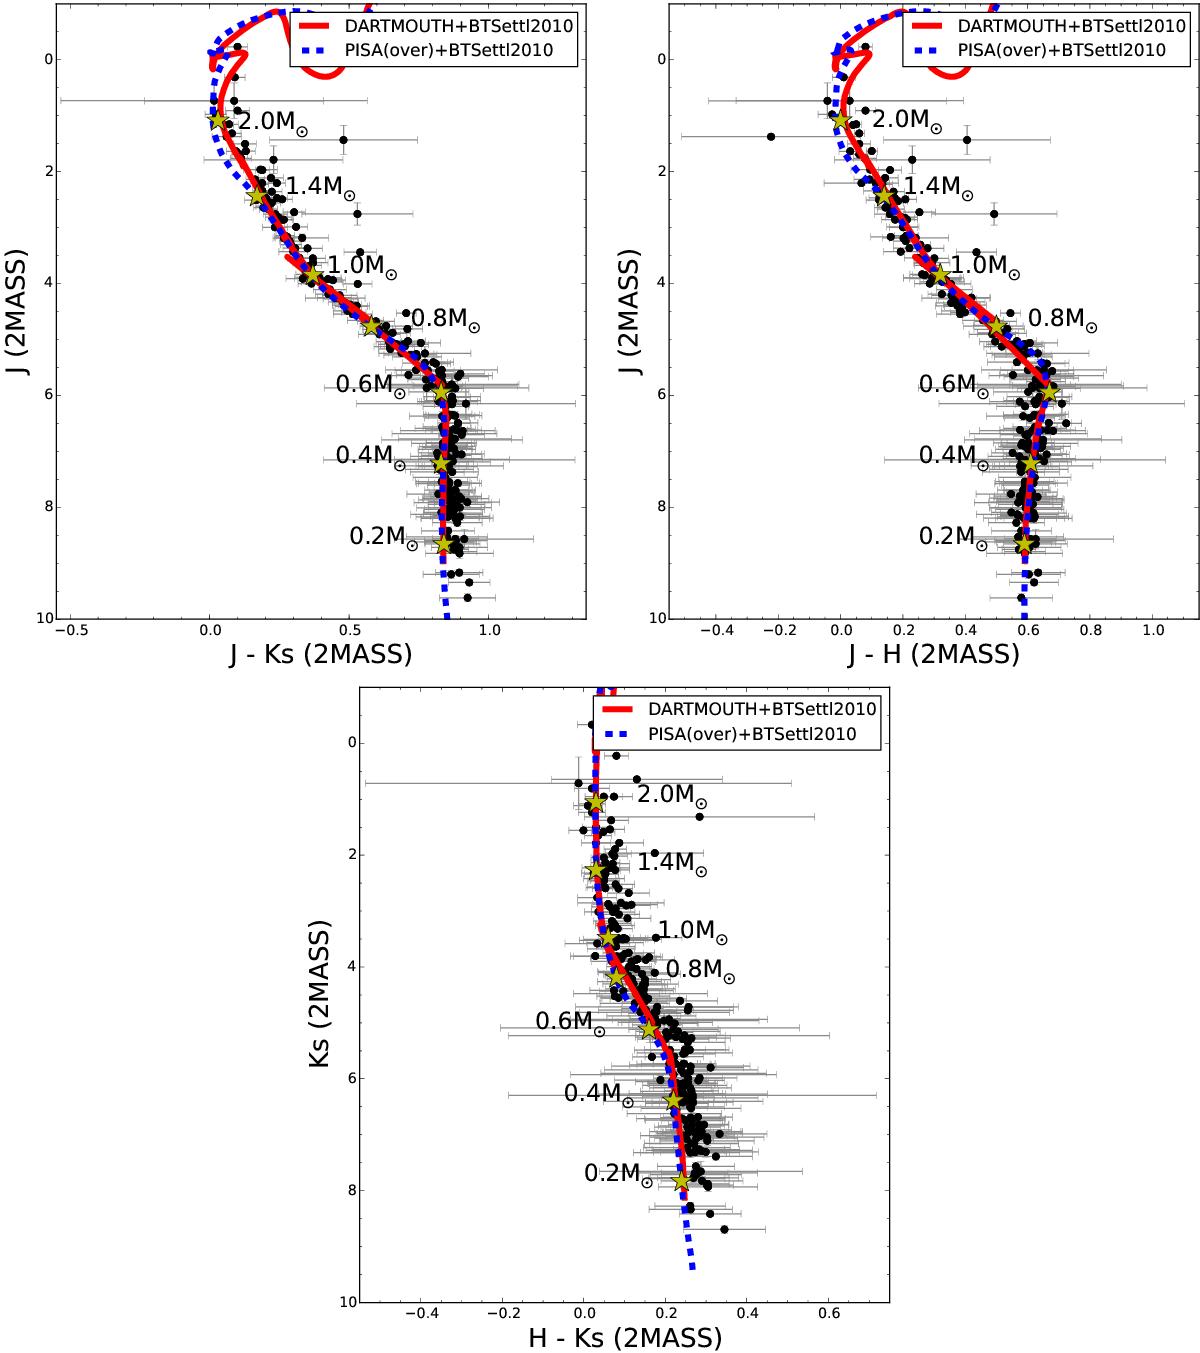
J vs. J−Ks (top left panel), J vs. J−H (top right panel) and Ks vs. H−Ks (bottom right panel) color–magnitude diagrams. The Hyades observed single-star sequence is overplotted with theoretical isochrones (630 Myr) from different evolutionary models – PISA (dashed blue line) and DARTMOUTH (solid red line). Synthetic photometry for isochrones are calculated in TA-DA using BT-Settl 2010 synthetic spectra.
Current usage metrics show cumulative count of Article Views (full-text article views including HTML views, PDF and ePub downloads, according to the available data) and Abstracts Views on Vision4Press platform.
Data correspond to usage on the plateform after 2015. The current usage metrics is available 48-96 hours after online publication and is updated daily on week days.
Initial download of the metrics may take a while.