| Issue |
A&A
Volume 585, January 2016
|
|
|---|---|---|
| Article Number | A149 | |
| Number of page(s) | 10 | |
| Section | Interstellar and circumstellar matter | |
| DOI | https://doi.org/10.1051/0004-6361/201526361 | |
| Published online | 13 January 2016 | |
Infall through the evolution of high-mass star-forming clumps⋆
1 Max-Planck-Institut für Radioastronomie, Auf dem Hügel 69, 53121 Bonn, Germany
e-mail: This email address is being protected from spambots. You need JavaScript enabled to view it.
; This email address is being protected from spambots. You need JavaScript enabled to view it.
; This email address is being protected from spambots. You need JavaScript enabled to view it.
; This email address is being protected from spambots. You need JavaScript enabled to view it.
; This email address is being protected from spambots. You need JavaScript enabled to view it.
; This email address is being protected from spambots. You need JavaScript enabled to view it.
; This email address is being protected from spambots. You need JavaScript enabled to view it.
; This email address is being protected from spambots. You need JavaScript enabled to view it.
; This email address is being protected from spambots. You need JavaScript enabled to view it.
; This email address is being protected from spambots. You need JavaScript enabled to view it.
2 University of Applied Sciences Bonn-Rhein-Sieg, Grantham-Allee 20, 53757 Sankt Augustin, Germany
Received: 20 April 2015
Accepted: 5 October 2015
Abstract
With the GREAT receiver at the Stratospheric Observatory for Infrared Astronomy (SOFIA), nine massive molecular clumps have been observed in the ammonia 32+−22− line at 1.8 THz in a search for signatures of infall. The sources were selected from the ATLASGAL submillimeter dust continuum survey of our Galaxy. Clumps with high masses covering a range of evolutionary stages based on their infrared properties were chosen. The ammonia line was detected in all sources, leading to five new detections and one confirmation of a previous detection of redshifted absorption in front of their strong THz continuum as a probe of infall in the clumps. These detections include two clumps embedded in infrared dark clouds. The measured velocity shifts of the absorptions compared to optically thin C17O (3–2) emission are 0.3–2.8 km s-1, corresponding to fractions of 3% to 30% of the free-fall velocities of the clumps. The ammonia infall signature is compared with complementary data of different transitions of HCN, HNC, CS, and HCO+, which are often used to probe infall because of their blue-skewed line profiles. The best agreement with the ammonia results is found for the HCO+ (4–3) transitions, but the latter is still strongly blended with emission from associated outflows. This outflow signature is far less prominent in the THz ammonia lines, which confirms it as a powerful probe of infall in molecular clumps. Infall rates in the range from 0.3 to 16 × 10-3 M⊙/yr were derived with a tentative correlation with the virial parameters of the clumps. The new observations show that infall on clump scales is ubiquitous through a wide range of evolutionary stages, from L/M covering about ten to several hundreds.
Key words: stars: formation / ISM: molecules / ISM: kinematics and dynamics
Final reduced data cube (FITS) are only available at the CDS via anonymous ftp to cdsarc.u-strasbg.fr (130.79.128.5) or via http://cdsarc.u-strasbg.fr/viz-bin/qcat?J/A+A/585/A149
© ESO, 2016
1. Introduction
Observation of infall is key to our understanding of the accretion process in star formation. High-resolution spectroscopy allows us to resolve molecular lines originating from the dense molecular envelopes of the forming (proto-) stars to deduce the kinematics of the gas. Optically thin emission lines probe weighted mean velocities through the whole envelope, hence they can be used to measure the systemic velocities of the clumps in which the forming stars reside. Optically thick lines are very sensitive to excitation gradients within the clumps. Such a gradient leads to differences in the blue- and redshifted peak temperatures of self-absorbed spectra: in case of infall and rising excitation toward the inner part of the clump, high optical depths will lead to probing the outer envelope at lower excitation with the redshifted gas, whereas the blueshifted gas is seen preferentially from the inner envelope at higher excitation and hence peak temperature. This process will lead to the well-known blue-skewed line profiles as a signature of infall. An excellent review of this method, including its many pitfalls, is given in Evans (2003). In addition to the excitation gradient, the optical depths need to attain proper values to allow for the separation of the two line peaks. Furthermore, any outflow activity in the clump can easily blend with the infall signature and obscure it.
To avoid these complications, redshifted absorption in front of bright continuum sources can be used to probe the velocity field on the line of sight toward the continuum. As continuum can serve either the centimeter free-free emission of Hii regions (Zhang & Ho 1997; Sollins et al. 2005; Beltrán et al. 2006) or – as recently shown by Wyrowski et al. (2012) – the bright submillimeter dust continuum emission of the clumps itself. In addition to the continuum background, this method requires transitions with high critical density so that the excitation temperature in the envelope is lower than the temperature of the continuum background. Given the typical high Einstein A values of hydride lines in the THz range, this can easily be achieved either with ground-state lines or lines originating from metastable levels such as the (J, K) states with J = K in ammonia. Compared to absorption studies toward Hii regions, the latter method can be employed toward a much wider range of evolutionary stages of massive clumps.
Ammonia source sample and observing parameters.
With the aim of studying infall through the different evolutionary stages of massive star-forming clumps, the selection of targets benefits enormously from unbiased Galactic plane surveys that have been conducted in the past years at mid-infrared (Churchwell et al. 2009; Carey et al. 2009; Wright et al. 2010, GLIMPSE/MIPSGAL/WISE) and far-infrared or submillimeter wavelengths (Molinari et al. 2010; Schuller et al. 2009; Ginsburg et al. 2013, Hi-GAL; ATLASGAL; BGPS). In particular the ATLASGAL survey at 870 μm in combination with the MIR surveys is well suited to select the most massive clumps in a range of evolutionary stages owing to its relatively high angular resolution at a long wavelength where the dust emission is still optically thin.
Wyrowski et al. (2012) presented observations toward three massive clumps with the Stratospheric Observatory for Infrared Astronomy (SOFIA) in the ammonia JK = 32+−22− at 1.8 THz to measure the infall signatures of the clumps. Ammonia absorption was detected in all of them, showing clear evidence for infall in each case with infall rates between 3 and 10 × 10-3 M⊙/yr. The spectra were modeled with the 1D radiative transfer code RATRAN (Hogerheijde & van der Tak 2000) using the physical structure of Rolffs et al. (2011) and a variety of velocity fields.
Taking advantage of the unbiased nature of the ATLASGAL dust continuum survey of the inner Galaxy, we selected new flux-limited samples of ATLASGAL sources with additional infrared selection criteria that ensure that we cover a broader range of evolutionary stages and luminosity. The systemic velocities of all of them have recently been measured using C17O (3–2) (Giannetti et al. 2014). The whole sample was characterized using the ATLASGAL data in combination with Herschel (König et al. 2015) and ground-based molecular line follow-up programs to allow detailed modeling of the clumps. Here, we present an extension of our SOFIA ammonia observing program to additional stages of massive star-forming clumps selected from the samples above, including earlier stages within infrared dark clouds.
2. Observations and data reduction
2.1. SOFIA
We used the L2 channel of the GREAT1 instrument (Heyminck et al. 2012) onboard SOFIA during Cycle 1 to observe the NH332 +−22 − line at 1810.379 GHz. In contrast to the situation reported by Wyrowski et al. (2012), we were able to tune the line into the upper sideband of the receiver to avoid a deep telluric absorption at 1812.5 GHz. As backends, fast Fourier transform spectrometers (Klein et al. 2012) were used (XFFTS) to cover a bandwidth of 2.5 GHz. The velocity resolution was smoothed to 0.5 km s-1 to increase the signal-to-noise ratio in the spectra. The beam size at the observing frequency is 16 arcsec.
The positions of the observed sources are given in Table 1. G34.26+0.15, which has been presented by Wyrowski et al. (2012), was reobserved to examine the line profile with a higher signal-to-noise. The nominal focus position was updated regularly against temperature drifts of the telescope structure. The pointing was established with the optical guide cameras to an accuracy of a few arcsec. All of the data were taken during the southern deployment flights from New Zealand in July 2013 under excellent observing conditions, resulting in SSB system temperatures at the ammonia frequency ranging from 1450 to 2050 K.
Spectra were calibrated to a  scale and were then converted to TMB assuming a forward efficiency of 0.97 and beam efficiencies of 0.67. Final processing and analysis of the data was then performed using the CLASS program within the GILDAS software2.
2.1.1. Dust continuum levels
To obtain reliable detections of the continuum by chopping off the atmospheric total power, the wobbling secondary was used with a typical throw of 120′′ about the cross elevation axis in a symmetric mode. Figure 1 shows the comparison with the PACS 160 μm continuum extracted from the Herschel Hi-GAL data (König et al. 2015) and scaled with the areas of the different beams. Given the differences in observing beams, the fluxes agree reasonably well.
2.2. Ground-based complementary data
In addition, ground-based spectra of dense gas tracers were used to complement the interpretation of the SOFIA ammonia absorption observations. Table 2 gives an overview of the lines. The systemic velocities from C17O (3–2) were taken from Giannetti et al. (2014), who also list details about the IRAM 30 m3 and APEX4 observations. Details about the Mopra observations of dense gas tracers will be presented in Wyrowski et al. (in prep.).
3. Results
3.1. Ammonia absorption
Complementary ground-based observations of dense gas tracers.
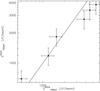 |
Fig. 1 Comparison of GREAT continuum levels with PACS 160 μ flux densities with nominal 20% errors. To account for the different beam sizes, we scaled the PACS fluxes with the ratio of the beam areas since the typical FWHM sizes from PACS are about 20”. The straight line indicates equal flux densities. |
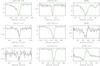 |
Fig. 2 NH332 +−22 − spectra of the observed sources. Results of Gaussian fits to the line profiles are overlaid in green. The systemic velocities of the sources, determined using C17O (3–2), are shown with dotted lines. W49N in addition shows at 30 m km s-1NH331 +−21 − from the other sideband. |
The averaged and baseline-subtracted spectra are shown on a TMB scale in Fig. 2. Ammonia absorption lines were detected in all sources, while G5.89-0.4 shows an additional redshifted emission component. When we applied single Gaussian fits to the line profiles, it became clear that several sources showed an additional broader component. For G327.3–0.6, G351.58–0.3, and G5.89-0.4 we therefore performed fits with an additional broad Gaussian component to account for the high-velocity absorption (emission in the case of G5.89-0.4). These fits are shown in Fig. 2 and are compared with C17O (3–2) line velocities. The APEX C17O observations have been obtained with a beam of 18 arcsec, very similar to the SOFIA beam at the ammonia frequency, and they probe, as optically thin lines, the systemic or averaged velocity of the massive clumps.
While for our kinematical interpretation of the observed line profiles the continuum is not relevant, a proper estimate of the continuum is required to reliably determine the line-to-continuum ratio that can be used to determine the opacity of the absorption lines and in turn the column density in the absorbing level. We therefore used the line-to-continuum ratio to determine the opacities of the absorption lines that are close to unity. They are in turn proportional to the column densities in the lower level (see Wyrowski et al. 2012).
The corresponding line and continuum parameters are given in Table 3, which consist of the peak temperatures TMB, FWHM line widths Δv and velocities  and
and  of the Gaussian fits, the velocity differences vshift beween the ammonia absorption and the C17O emission lines, the measured continuum offsets TC of the spectra and the line optical depths τ computed from the line-to-continuum ratios. Five new clumps with redshifted absorption were found. For G34.26 the redshifted absorption was reported in Wyrowski et al. (2012). G5.89-0.4 is dominated by ammonia from outflowing gas (see, e.g., the recent SOFIA study of this source by Leurini et al. 2015, which also shows P Cygni profiles in water and OH, originating from the outflow). An expanding shell structure of W49N has been discussed in Peng et al. (2010) and most likely gives rise to the kinematics observed in the ammonia P-Cygni-like line profile. In W33A an outflow-dominated line profile similar to ammonia is detected in the Herschel/HIFI water ground-state line (Marseille et al. 2010).
Line parameters from Gaussian fits to the NH3 lines.
3.2. Dense gas probes
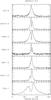 |
Fig. 3 Ground-based observations of millimeter and submillimeter transitions of the dense gas tracers HCN/HNC/CS/HCO+ in G23.21–0.3 observed with the IRAM 30 m and APEX telescopes. The systemic velocity from C17O (3–2) is indicated with a dashed line. |
All of the ammonia absorption line sources presented here and in Wyrowski et al. (2012) were observed in dense gas tracers, with the exception of G5.89-0.4 and W33A. Figures 3, A.1, and A.2 show the observed line profiles. Using these complementary data, we can compare the kinematical signatures of different molecules with the observed ammonia absorption. In three cases even lines from two different Jupper levels are available. Clump G23.21-0.3, shown in Fig. 3, is an instructive example: while absorption redshifted by 1.6 km s-1 was detected in ammonia, the line profiles from the dense gas probes do not show consistent blue-skewed profiles. CS and HCN show broad line wings indicative of a strong outflow that apparently in these lines hides the signature of infalling gas in the envelope. HNC and HCO+ show much weaker outflow wings, and their (4–3) transitions present the blue-skewed signature of infall. Interestingly, the (1–0) transitions of these molecules show the reverse. The critical density of these lines differs by about a factor 50 (since the Einstein Aul values scale with ν3), hence the (1–0) lines might be dominated by low-density outer layers (López-Sepulcre et al. 2010).
Table 4 gives an overview of the derived kinematic signatures from all the individual spectra we have available. While there are clear variations for a given clump in different molecular lines, the best agreement with the ammonia absorption results is found for HCO+ (4–3), and only W49N does not agree.
Comparison of kinematic signatures of ammonia absorption with ground-based observations of emission lines of HCN/HNC/CS/HCO+.
4. Analysis
4.1. Source sample
The sample of sources for which we have ammonia absorption lines covers a range of luminosities and evolutionary phases. Table 1 gives the adopted distances and the luminosities of the sources. Where applicable, we also added W43MM1 and G31.41 from Wyrowski et al. (2012) to our analysis here. The luminosities were derived from fits to the spectral energy distributions consisting of data from the Herschel Hi-GAL, WISE, and ATLASGAL surveys, and they are discussed in detail in König et al. (2015). Figure 4 shows the corresponding mass-luminosity diagram: our sample covers not only a wide range in clump masses, but also a range of about 10 in luminosity-to-mass ratio, L/M, as an indicator of evolutionary stage. Sources with even lower L/M will be difficult to observe in the 1.8 THz ammonia line because these clumps are colder and therefore become faint in the continuum at 1.8 THz.
Different from the distance adopted by Wyrowski et al. (2012), we here adopted the closer distance of König et al. (2015) for G34.26+0.2. This distance is based on recent trigonometric parallax measurements toward neighboring clouds (including G34.41 from our sample) (Kurayama et al. 2011).
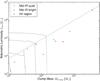 |
Fig. 4 Mass-luminosity diagram of clumps with ammonia absorption line detections with evolutionary tracks as indicated in Molinari et al. (2008): during the infall phase clumps move upward in luminosity, while later in the envelope clean-up phase, clumps move to the left when they lose their envelopes. |
4.2. Physical structure of the clumps
We constrained the physical structure of the clumps with luminosities from the spectral energy distributions (Table 1) and the submm dust continuum emission profiles from the ATLASGAL survey. This is similar to the approach in Rolffs et al. (2011), whose results were used for the modeling in Wyrowski et al. (2012). The luminosities of the clumps then dictate a dust temperature structure of the form T ~ L0.25 × r-0.4 (e.g., Rowan-Robinson 1980). The factor of proportionality was adjusted to best fit the observed continuum at the ammonia frequency, which led to agreement between model and observed continuum flux within 20% for a common factor. The density structure n = n1pc × (r/ 1pc)αn and outer radii Rout of the clumps were constrained by computing the radial structure of the submillimeter dust emission in circular annuli; an example is given in Fig. 5. The inner radius was defined by a dust destruction temperature of 1000 K, leading to radii of only a few AU, so small compared to the rest of the envelope that the choice does not influence the results of the modeling.
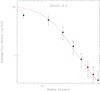 |
Fig. 5 Example of constraining the radial physical structure with the help of the 870 μm ATLASGAL submm dust continuum radial profiles in G23.21-0.3. As listed in Table 5, the fit corresponds to a n ~ r-2 density power law and an outer radius of 1.8 pc. |
4.3. Radiative transfer modeling
Fit parameters from RATRAN modeling of the ammonia lines.
This physical structure of the envelopes was then implemented in RATRAN models (Hogerheijde & van der Tak 2000) with power laws for the density and temperature. We assumed the gas temperature to be equal to the dust temperature. The density structure was varied to reproduce the dust continuum profiles. This leaves the ammonia abundance X(NH3), the velocity fields, and the turbulence widths δvt as a function of radius as free parameters for the modeling of the ammonia lines. Initial guesses for the turbulence widths were taken from the observed C17O (3−2) line widths.
Similar to Rolffs et al. (2011) and Wyrowski et al. (2012), the velocity field was adjusted for sources showing redshifted absorption by varying fff = v(r) /vff(r), hence the fraction of the free-fall velocity  caused at a given radius by the enclosed mass Menc. Figure 6 shows the results of the ammonia line modeling, and Table 5 gives the corresponding fit parameters. The fit parameters can be adjusted to precisely fit the depth, widths, and red part of the absorption. But several sources – G23.21-0.3, G351.58-0.3, and G327.29-0.5 – show shallow blue absorption wings that are not reproduced by the fits because no outflow component is included in the model. Nevertheless, the fit methods allow us to reliably adjust the free-fall fraction fff even in these cases.
4.4. Simultaneous HCO+ modeling
Even more indications of an additional outflow component are seen in most HCO+ lines. The dotted fits to the HCO+ lines in Fig. 6 show the infall models with only an adjustment of the HCO+ abundance. In general, they cannot reproduce the observed profile signatures, that is, the broad emission, the deep self-absorption, and the relative intensities of the blue and red peaks. We therefore added outflow emission to the RATRAN models of HCO+ in the center plane of the envelope before the ray-tracing step, as was done in Mottram et al. (2013). Examples of profiles that can be fit satisfyingly with this additional component are G34.26+0.1 and G35.20-0.7, as shown in Fig. 6. The outflow components have typical widths of 10 km s-1 and are in some cases slightly shifted from the systemic velocities to account for the asymmetry of the outflow lobes. For several clumps, the HCO+ abundances are relatively small but consistent with typical depletion factors found in Giannetti et al. (2014). Still, several HCO+ profiles cannot be reproduced with the simplicity of the spherical models, pointing to inherent difficulties in the interpretation of HCO+ profiles as an infall indicator.
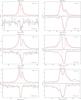 |
Fig. 6 Comparison of APEX HCO+ (4–3) observations with the SOFIA ammonia absorption in sources showing redshifted absorption. We show the RATRAN modeling result of HCO+ (4–3) in red using variable abundances with and without (dotted) additional outflow components. |
5. Discussion and conclusions
Adding the results from Wyrowski et al. (2012), eight out of eleven massive clumps have been found with redshifted absorption that is indicative of infall motions. This fraction of 72% is substantially higher than found in past searches for the blue-skewed profile signature, see, for example, Fuller et al. (2005), Wu et al. (2007), López-Sepulcre et al. (2010), Reiter et al. (2011) and Rygl et al. (2013).
From our comparison of ammonia absorption with line profiles of dense gas tracers lines, we conclude that outflows are the most likely reason for hiding infall motions in the clump envelopes. This effect is less prominent in the THz ammonia spectra. While we see the red lobe due to the high excitation even in emission in the extreme outflow source G5.89-0.4, other sources are, if at all, only affected by blueshifted absorption from the outflow in front of the continuum. These absorption wings are similar to the blue emission wings in the CS (7–6) spectra, but do not affect the measurements of the main redshifted absorption from the envelope. The excitation in most outflows is too low to excite the high critical density THz ammonia line (ncr(25 K) ≈ 109/τcm-3), but are high enough for the submillimeter lines, where already little outflowing gas strongly influences the profiles. The best agreement is found with HCO+ (4–3), that is, for a line with higher critical density than the (1–0) line and of a molecule less enhanced in outflows than for instance CS and HCN (e.g., Bachiller et al. 2001, and see line wings in Fig. 3). The simulations of Smith et al. (2013) instead predicted the (1–0) to be the better probe of infall signatures, but these simulations did not yet include any outflow activity.
From the RATRAN modeling of the absorption lines the infall rates can be also derived as Ṁ = 4πR2mH2nv assuming spherical infall. We list in Table 5 infall rates in the range from 0.3 to 16 × 10-3 M⊙/yr using the beam size of the observations as radius. Tan et al. (2014) reported 14.6 × 10⁻³ M⊙/yr as a characteristic infall rate for a free-falling clump of 1000 M⊙, which is within a factor of two comparable to our infall rate results considering the masses, column densities, and fractions of the free-fall velocity of 0.03 to 0.3 of our sources. We compare these infall rates in Fig. 7 to the virial parameters αvir = Mvir/M of the clumps derived by Giannetti et al. (2014) using C17O . The clumps W43 and G31.41 from Wyrowski et al. (2012) were included, and the dependence between virial parameter and the infall velocities is also shown. There is a slight trend seen toward higher infall rates and velocities for lower virial parameter values αvir with Spearman correlation coefficients of −0.55 and −0.43, respectively. This is consistent with the expectation that the more gravity dominates, the higher the inward accelerations become. It is likewise expected that the correlation of the infall rates with the mass of the clumps is even higher, with a Spearman coefficient of 0.86.
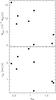 |
Fig. 7 Comparison of the infall velocities and rates from the ammonia absorption measurements with the virial parameter of the clumps from Giannetti et al. (2014). |
The new observations show that infall on clump scales is ubiquitous throughout a wide range of evolutionary stages, including clumps in infrared dark clouds, from L/M covering about 10−70. While we did not find a correlation of the infall rate or velocity with L/M (Spearman coefficients of −0.29 and −0.14, respectively), it is notable that the three sources with blueshifted emission have the two highest and the fifth highest L/M, either indicating that infall has stopped or that is has become undetectable as a result of relatively strong outflows and expanding motions compared to the colder envelope in which the other clumps show the infall signature. To search in more detail for evolutionary effects requires a larger sample and expanding this study to lower L/M. For this purpose, the 572 GHz
ortho ground-state line of ammonia might be a future option for SOFIA to continue absorption studies to sources that are too cold to have detectable continuum at 1.8 THz.
GREAT is a development by the MPI für Radioastronomie and the KOSMA/Universität zu Köln, in cooperation with the MPI für Sonnensystemforschung and the DLR Institut für Planetenforschung.
Based on observations carried out with the IRAM 30 m telescope. IRAM is supported by INSU/CNRS (France), MPG (Germany) and IGN (Spain).
Based on observations with the Atacama Pathfinder EXperiment (APEX) telescope. APEX is a collaboration between the Max Planck Institute for Radio Astronomy, the European Southern Observatory, and the Onsala Space Observatory.
Acknowledgments
We thank the referee for comments and suggestions that have helped to improve this manuscript. We thank J. Mottram for making the RATRAN code with additional outflow component available. This work was partially carried out within the Collaborative Research Council 956, subproject A6, funded by the Deutsche Forschungsgemeinschaft (DFG). Based (in part) on observations made with the NASA/DLR Stratospheric Observatory for Infrared Astronomy. SOFIA Science Mission Operations are conducted jointly by the Universities Space Research Association, Inc., under NASA contract NAS2-97001, and the Deutsches SOFIA Institut under DLR contract 50 OK 0901.
References
- Bachiller, M., Perez Gutierrez, M., Kumar, M., & Tafalla, M. 2001, A&A, 372, 899 [NASA ADS] [CrossRef] [EDP Sciences] [Google Scholar]
- Beltrán, M. T., Cesaroni, R., Codella, C., et al. 2006, Nature, 443, 427 [NASA ADS] [CrossRef] [PubMed] [Google Scholar]
- Carey, S. J., Noriega-Crespo, A., Mizuno, D. R., et al. 2009, PASP, 121, 76 [NASA ADS] [CrossRef] [Google Scholar]
- Churchwell, E., Babler, B. L., Meade, M. R., et al. 2009, PASP, 121, 213 [NASA ADS] [CrossRef] [Google Scholar]
- Evans, II, N. 2003, in SFChem 2002: Chemistry as a Diagnostic of Star Formation, eds. C. L. Curry, & M. Fich, 157 [Google Scholar]
- Fuller, G. A., Williams, S. J., & Sridharan, T. K. 2005, A&A, 442, 949 [NASA ADS] [CrossRef] [EDP Sciences] [Google Scholar]
- Giannetti, A., Wyrowski, F., Brand, J., et al. 2014, A&A, 570, A65 [NASA ADS] [CrossRef] [EDP Sciences] [Google Scholar]
- Ginsburg, A., Glenn, J., Rosolowsky, E., et al. 2013, ApJS, 208, 14 [NASA ADS] [CrossRef] [MathSciNet] [Google Scholar]
- Heyminck, S., Graf, U. U., Güsten, R., et al. 2012, A&A, 542, L1 [NASA ADS] [CrossRef] [EDP Sciences] [Google Scholar]
- Hogerheijde, M. R., & van der Tak, F. F. S. 2000, A&A, 362, 697 [NASA ADS] [Google Scholar]
- Klein, B., Hochgürtel, S., Krämer, I., et al. 2012, A&A, 542, L3 [NASA ADS] [CrossRef] [EDP Sciences] [Google Scholar]
- König, C., Urquhart, J. S., Csengeri, T., et al. 2015, A&A, submitted [Google Scholar]
- Kurayama, T., Nakagawa, A., Sawada-Satoh, S., et al. 2011, PASJ, 63, 513 [NASA ADS] [Google Scholar]
- Leurini, S., Wyrowski, F., Wiesemeyer, H., et al. 2015, A&A, 584, A70 [NASA ADS] [CrossRef] [EDP Sciences] [Google Scholar]
- López-Sepulcre, A., Cesaroni, R., & Walmsley, C. M. 2010, A&A, 517, A66 [NASA ADS] [CrossRef] [EDP Sciences] [Google Scholar]
- Marseille, M. G., van der Tak, F. F. S., Herpin, F., & Jacq, T. 2010, A&A, 522, A40 [NASA ADS] [CrossRef] [EDP Sciences] [Google Scholar]
- Molinari, S., Pezzuto, S., Cesaroni, R., et al. 2008, A&A, 481, 345 [NASA ADS] [CrossRef] [EDP Sciences] [Google Scholar]
- Molinari, S., Swinyard, B., Bally, J., et al. 2010, PASP, 122, 314 [NASA ADS] [CrossRef] [Google Scholar]
- Mottram, J. C., van Dishoeck, E. F., Schmalzl, M., et al. 2013, A&A, 558, A126 [NASA ADS] [CrossRef] [EDP Sciences] [Google Scholar]
- Peng, T.-C., Wyrowski, F., van der Tak, F. F. S., Menten, K. M., & Walmsley, C. M. 2010, A&A, 520, A84 [NASA ADS] [CrossRef] [EDP Sciences] [Google Scholar]
- Reiter, M., Shirley, Y. L., Wu, J., et al. 2011, ApJ, 740, 40 [NASA ADS] [CrossRef] [Google Scholar]
- Rolffs, R., Schilke, P., Wyrowski, F., et al. 2011, A&A, 527, A68 [NASA ADS] [CrossRef] [EDP Sciences] [Google Scholar]
- Rowan-Robinson, M. 1980, ApJS, 44, 403 [NASA ADS] [CrossRef] [Google Scholar]
- Rygl, K. L. J., Wyrowski, F., Schuller, F., & Menten, K. M. 2013, A&A, 549, A5 [NASA ADS] [CrossRef] [EDP Sciences] [Google Scholar]
- Schuller, F., Menten, K. M., Contreras, Y., et al. 2009, A&A, 504, 415 [NASA ADS] [CrossRef] [EDP Sciences] [Google Scholar]
- Smith, R. J., Shetty, R., Beuther, H., Klessen, R. S., & Bonnell, I. A. 2013, ApJ, 771, 24 [NASA ADS] [CrossRef] [Google Scholar]
- Sollins, P. K., Zhang, Q., Keto, E., & Ho, P. T. P. 2005, ApJ, 624, L49 [NASA ADS] [CrossRef] [Google Scholar]
- Tan, J. C., Beltrán, M. T., Caselli, P., et al. 2014, Protostars and Planets VI, 149 [Google Scholar]
- van der Tak, F. F. S., Chavarría, L., Herpin, F., et al. 2013, A&A, 554, A83 [NASA ADS] [CrossRef] [EDP Sciences] [Google Scholar]
- Wright, E. L., Eisenhardt, P. R. M., Mainzer, A. K., et al. 2010, AJ, 140, 1868 [NASA ADS] [CrossRef] [Google Scholar]
- Wu, Y., Henkel, C., Xue, R., Guan, X., & Miller, M. 2007, ApJ, 669, L37 [NASA ADS] [CrossRef] [Google Scholar]
- Wyrowski, F., Güsten, R., Menten, K. M., Wiesemeyer, H., & Klein, B. 2012, A&A, 542, L15 [NASA ADS] [CrossRef] [EDP Sciences] [Google Scholar]
- Zhang, Q., & Ho, P. T. P. 1997, ApJ, 488, 241 [NASA ADS] [CrossRef] [Google Scholar]
Appendix A: Spectra of dense gas tracers
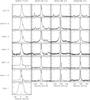 |
Fig. A.1 Ground-based observations of millimeter and submillimeter transitions of the dense gas tracers HCN/HNC/CS/HCO+. The systemic velocity from C17O (3–2) is indicated with a dashed line. |
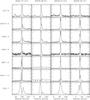 |
Fig. A.2 Ground-based observations of millimeter and submillimeter transitions of the dense gas tracers HCN/HNC/CS/HCO+. The systemic velocity from C17O (3–2) is indicated with a dashed line. |
All Tables
Comparison of kinematic signatures of ammonia absorption with ground-based observations of emission lines of HCN/HNC/CS/HCO+.
All Figures
|
Fig. 1 Comparison of GREAT continuum levels with PACS 160 μ flux densities with nominal 20% errors. To account for the different beam sizes, we scaled the PACS fluxes with the ratio of the beam areas since the typical FWHM sizes from PACS are about 20”. The straight line indicates equal flux densities. |
| In the text | |
|
Fig. 2 NH332 +−22 − spectra of the observed sources. Results of Gaussian fits to the line profiles are overlaid in green. The systemic velocities of the sources, determined using C17O (3–2), are shown with dotted lines. W49N in addition shows at 30 m km s-1NH331 +−21 − from the other sideband. |
| In the text | |
|
Fig. 3 Ground-based observations of millimeter and submillimeter transitions of the dense gas tracers HCN/HNC/CS/HCO+ in G23.21–0.3 observed with the IRAM 30 m and APEX telescopes. The systemic velocity from C17O (3–2) is indicated with a dashed line. |
| In the text | |
|
Fig. 4 Mass-luminosity diagram of clumps with ammonia absorption line detections with evolutionary tracks as indicated in Molinari et al. (2008): during the infall phase clumps move upward in luminosity, while later in the envelope clean-up phase, clumps move to the left when they lose their envelopes. |
| In the text | |
|
Fig. 5 Example of constraining the radial physical structure with the help of the 870 μm ATLASGAL submm dust continuum radial profiles in G23.21-0.3. As listed in Table 5, the fit corresponds to a n ~ r-2 density power law and an outer radius of 1.8 pc. |
| In the text | |
|
Fig. 6 Comparison of APEX HCO+ (4–3) observations with the SOFIA ammonia absorption in sources showing redshifted absorption. We show the RATRAN modeling result of HCO+ (4–3) in red using variable abundances with and without (dotted) additional outflow components. |
| In the text | |
|
Fig. 7 Comparison of the infall velocities and rates from the ammonia absorption measurements with the virial parameter of the clumps from Giannetti et al. (2014). |
| In the text | |
|
Fig. A.1 Ground-based observations of millimeter and submillimeter transitions of the dense gas tracers HCN/HNC/CS/HCO+. The systemic velocity from C17O (3–2) is indicated with a dashed line. |
| In the text | |
|
Fig. A.2 Ground-based observations of millimeter and submillimeter transitions of the dense gas tracers HCN/HNC/CS/HCO+. The systemic velocity from C17O (3–2) is indicated with a dashed line. |
| In the text | |
Current usage metrics show cumulative count of Article Views (full-text article views including HTML views, PDF and ePub downloads, according to the available data) and Abstracts Views on Vision4Press platform.
Data correspond to usage on the plateform after 2015. The current usage metrics is available 48-96 hours after online publication and is updated daily on week days.
Initial download of the metrics may take a while.