Free Access
Fig. 1
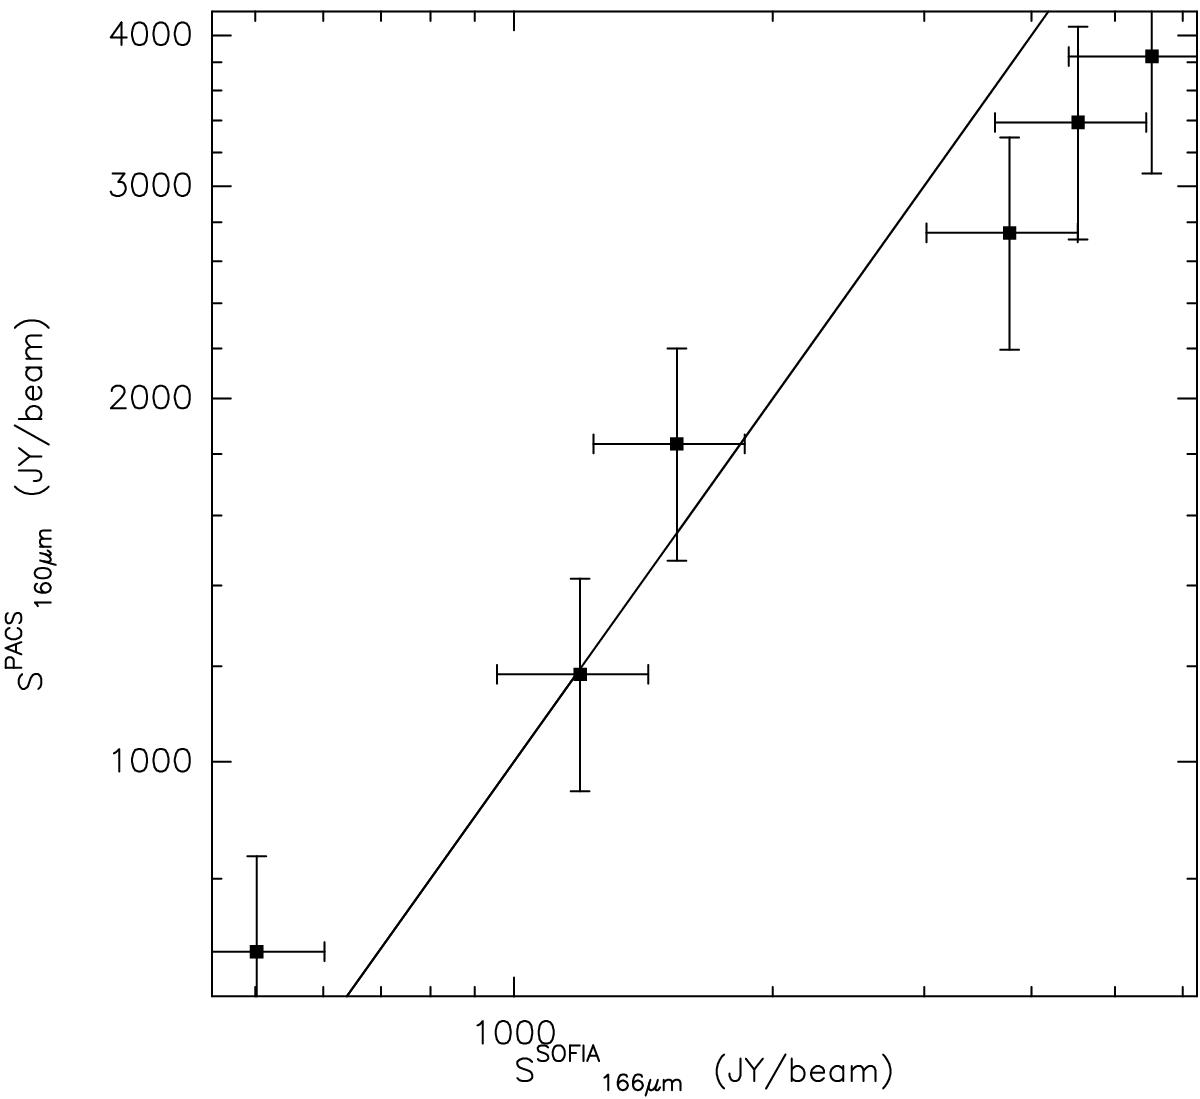
Comparison of GREAT continuum levels with PACS 160 μ flux densities with nominal 20% errors. To account for the different beam sizes, we scaled the PACS fluxes with the ratio of the beam areas since the typical FWHM sizes from PACS are about 20”. The straight line indicates equal flux densities.
Current usage metrics show cumulative count of Article Views (full-text article views including HTML views, PDF and ePub downloads, according to the available data) and Abstracts Views on Vision4Press platform.
Data correspond to usage on the plateform after 2015. The current usage metrics is available 48-96 hours after online publication and is updated daily on week days.
Initial download of the metrics may take a while.