Fig. 7
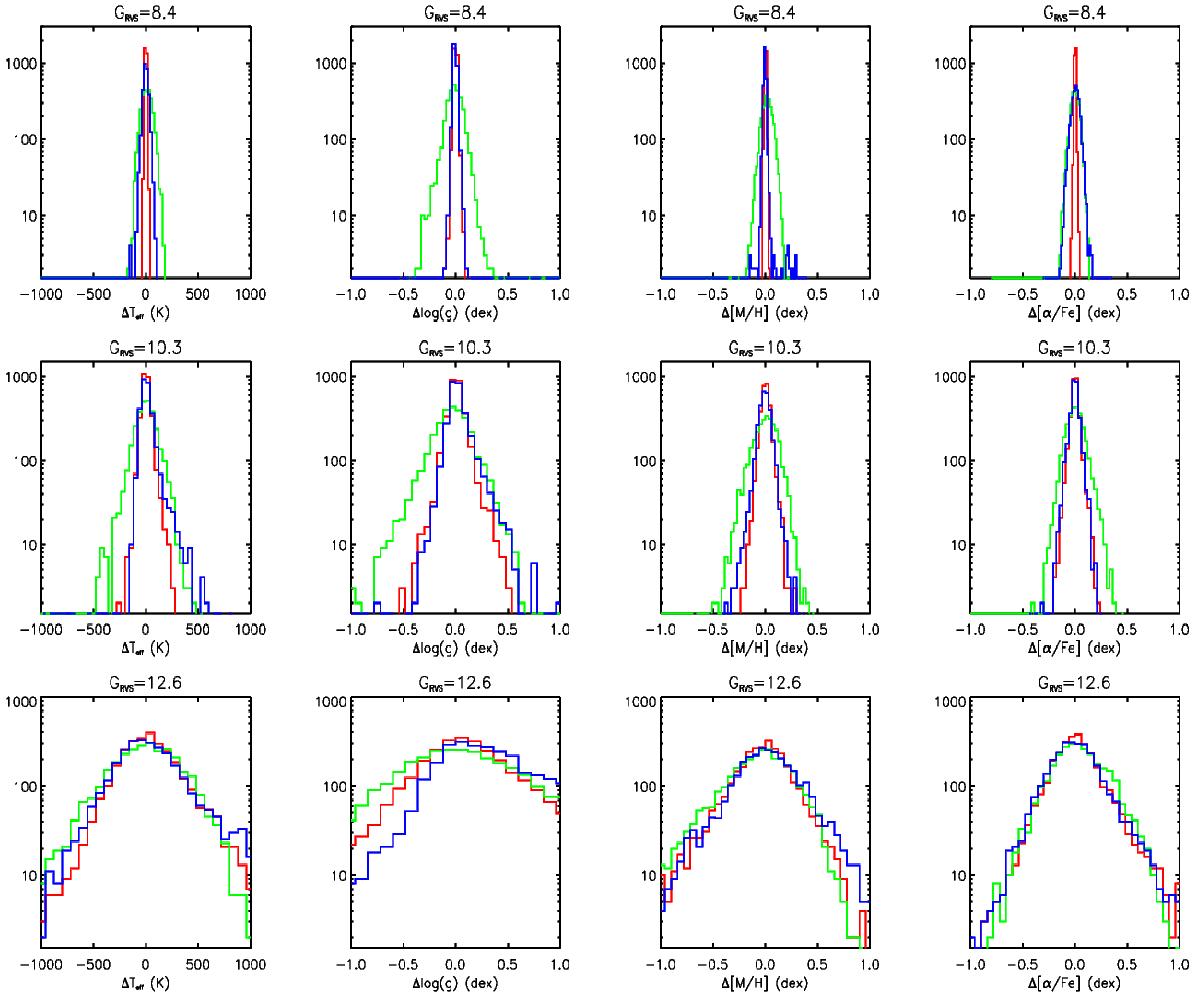
Distributions of the residuals in the recovered atmospheric parameters (Δθ = θrec − θreal) for a subsample of cool random spectra with GRVS = 8.4, 10.3, and 12.6 (i.e. S/N values of 350, 125, and 20, from top to bottom, respectively) and defined by 4000 <Teff< and 8000 K. The different colours represent the different tested methods: FERRE, ANN, and MATISSEG in red, green and blue, respectively.
Current usage metrics show cumulative count of Article Views (full-text article views including HTML views, PDF and ePub downloads, according to the available data) and Abstracts Views on Vision4Press platform.
Data correspond to usage on the plateform after 2015. The current usage metrics is available 48-96 hours after online publication and is updated daily on week days.
Initial download of the metrics may take a while.