Fig. 6
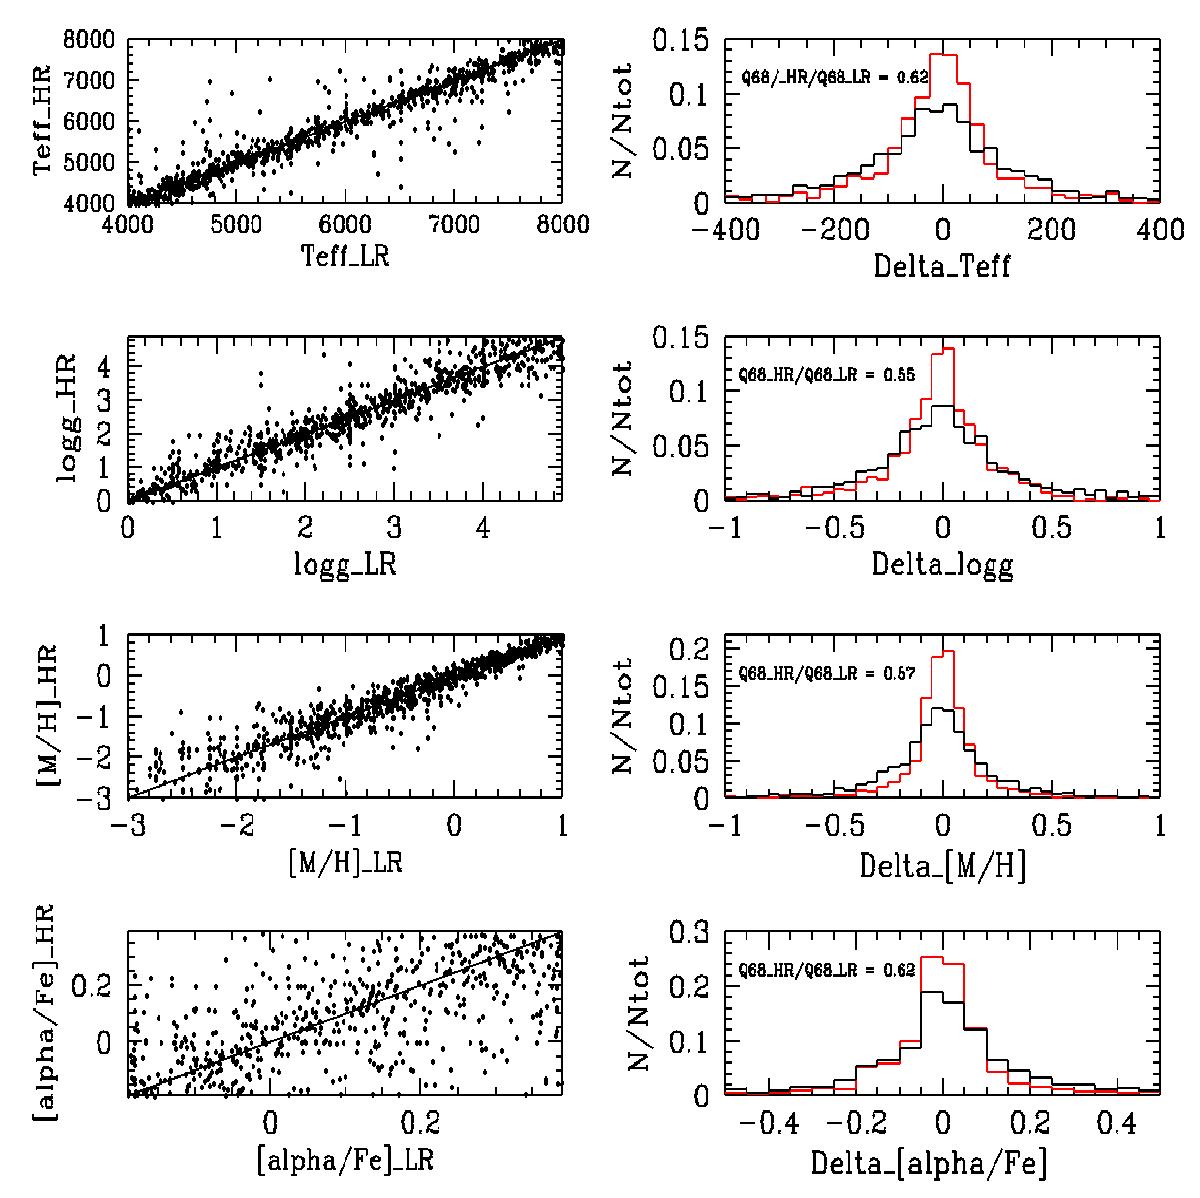
Left panels: MATISSEG results for cool random spectra of S/N ~ 20 at the nominal high resolution (HR) compared to those for the lower resolution (LR) spectra of the same stars (and same S/N value). Right panels: normalized distribution of residuals for the high-resolution spectra (red curve) and for the low-resolution ones (black curve). The ratio of the 68% quantile values of both distributions is given for each stellar parameter.
Current usage metrics show cumulative count of Article Views (full-text article views including HTML views, PDF and ePub downloads, according to the available data) and Abstracts Views on Vision4Press platform.
Data correspond to usage on the plateform after 2015. The current usage metrics is available 48-96 hours after online publication and is updated daily on week days.
Initial download of the metrics may take a while.