Fig. 5
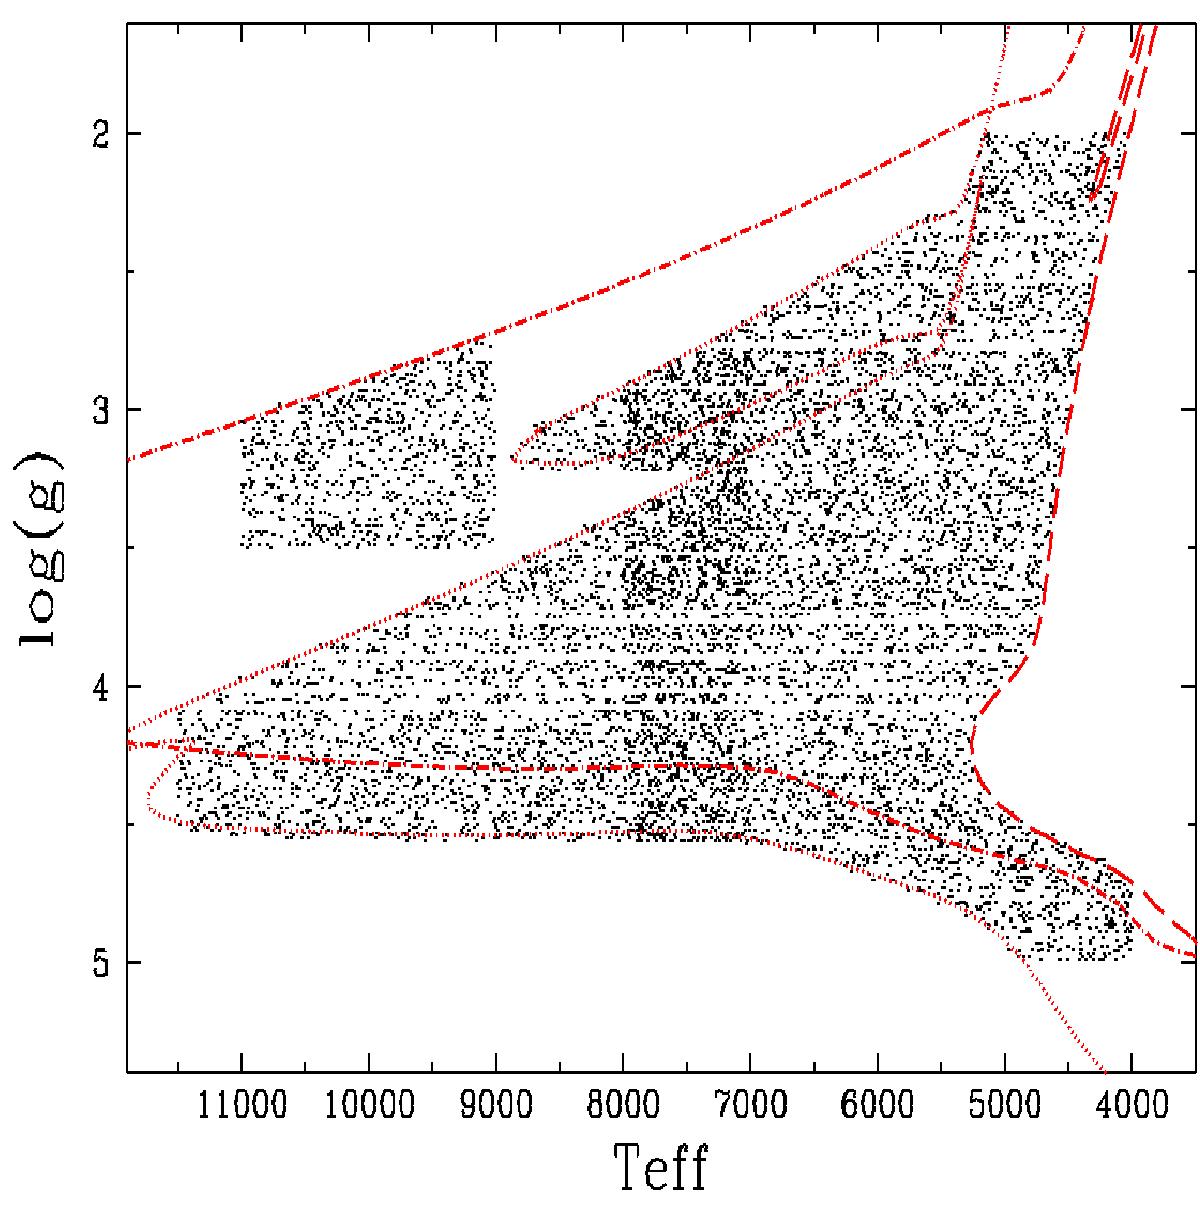
Hertzsprung-Russell diagram of the random spectra (black dots) produced for the code performance tests (Teff and log(g) are in K and cm/s2, respectively). The isochrones in long-dashed, dotted, and dash-dotted lines correspond, respectively, to Z = 0.06 and 13 Gyr, Z = 10-4 and 1 Gyr, and Z = 0.019 and 100 Myr. The higher density of random spectra between 7000 and 8000 K is a consequence of the temperature overlap between the two different reference grids, for hot and cool stars (see Sect. 3.1), from which the random spectra have been interpolated.
Current usage metrics show cumulative count of Article Views (full-text article views including HTML views, PDF and ePub downloads, according to the available data) and Abstracts Views on Vision4Press platform.
Data correspond to usage on the plateform after 2015. The current usage metrics is available 48-96 hours after online publication and is updated daily on week days.
Initial download of the metrics may take a while.