Fig. A.3
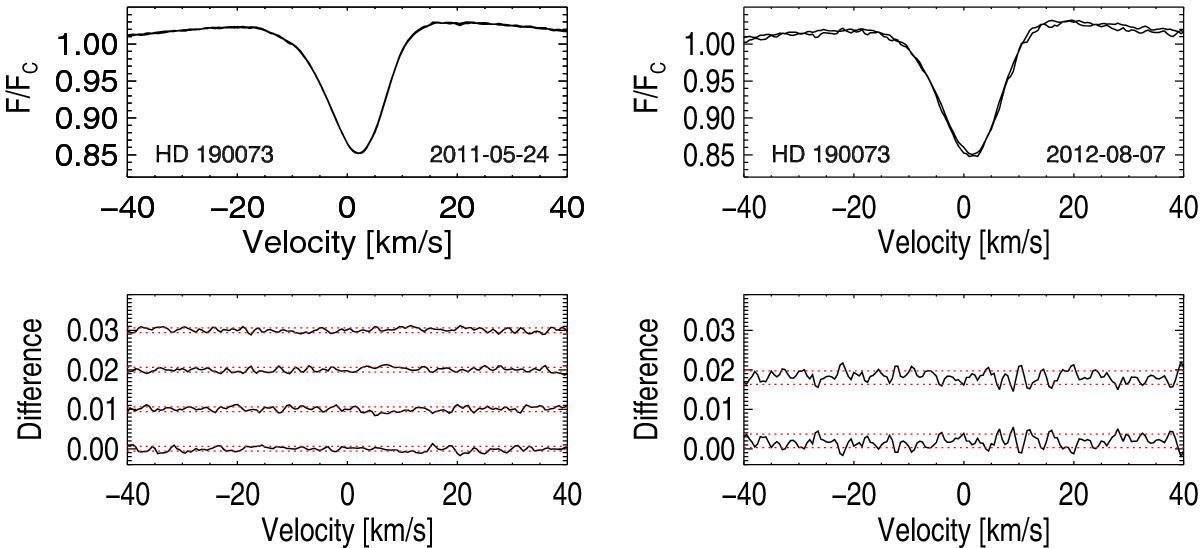
Comparison of the LSD Stokes I profiles of HD 190073 computed for the individual subexposures obtained on 2011 May 24 with a time lapse of about 10 min (left panel) and on 2012 August 7 with a time lapse of 30 min (right panel). The dashed lines on the lower plots indicate the standard deviation limits.
Current usage metrics show cumulative count of Article Views (full-text article views including HTML views, PDF and ePub downloads, according to the available data) and Abstracts Views on Vision4Press platform.
Data correspond to usage on the plateform after 2015. The current usage metrics is available 48-96 hours after online publication and is updated daily on week days.
Initial download of the metrics may take a while.