Fig. A.2
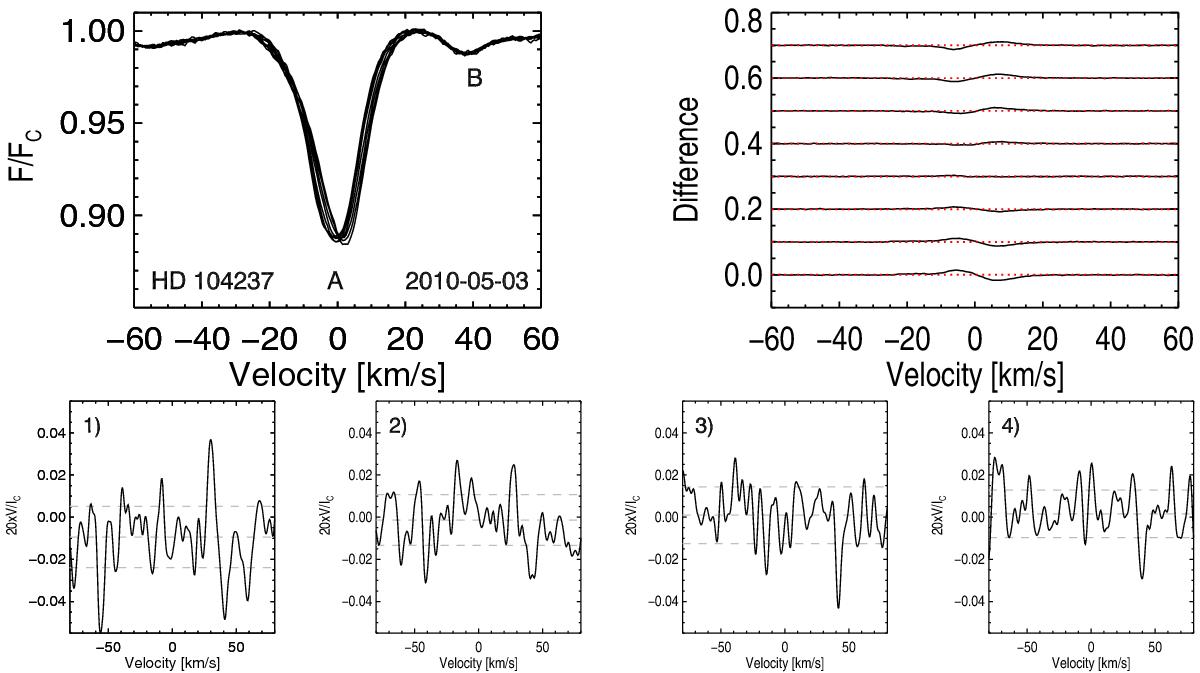
Upper row: comparison of the LSD Stokes I profiles of HD 104237 computed for the individual subexposures obtained with a time lapse of 2.2 min (left side) and differences between Stokes I profiles computed for the individual subexposures and the average Stokes I profile with standard deviation limits indicated by the dashed lines (right side). Lower row: Stokes V spectra calculated for the combination of pairs of two subexposures with the quarter-wave plate angles separated by 90 degrees, four pairs in all.
Current usage metrics show cumulative count of Article Views (full-text article views including HTML views, PDF and ePub downloads, according to the available data) and Abstracts Views on Vision4Press platform.
Data correspond to usage on the plateform after 2015. The current usage metrics is available 48-96 hours after online publication and is updated daily on week days.
Initial download of the metrics may take a while.