Fig. 4
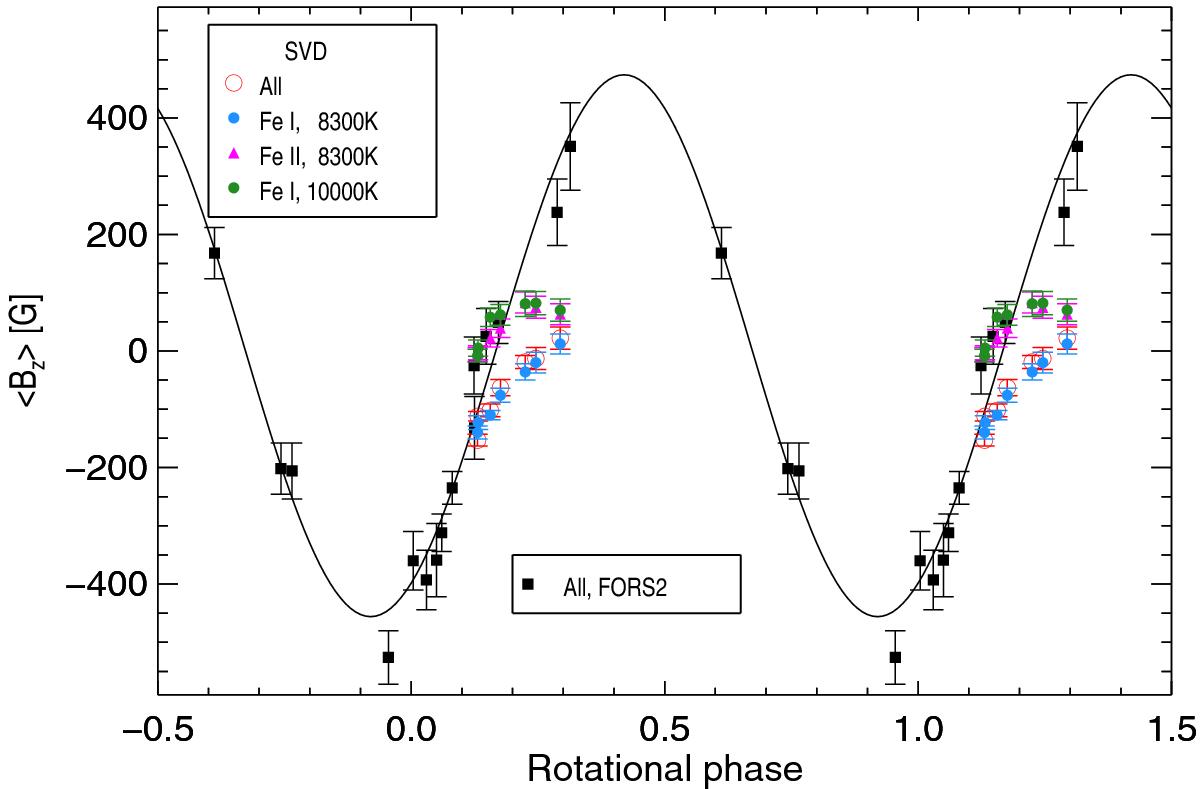
Phase diagram for the longitudinal magnetic field measurements of HD 101412 carried out using low-resolution FORS 2 spectropolarimetric observations (black filled squares) and high-resolution HARPSpol observations. Red open circles represent the SVD measurements via all metallic lines, blue filled circles via Fe i lines at Teff = 8300 K, magenta triangles via Fe ii lines at Teff = 8300 K, and green filled circles via Fe i lines at Teff = 10 000 K. The fit in the plot refers to Hubrig et al. (2011b).
Current usage metrics show cumulative count of Article Views (full-text article views including HTML views, PDF and ePub downloads, according to the available data) and Abstracts Views on Vision4Press platform.
Data correspond to usage on the plateform after 2015. The current usage metrics is available 48-96 hours after online publication and is updated daily on week days.
Initial download of the metrics may take a while.