Fig. 3
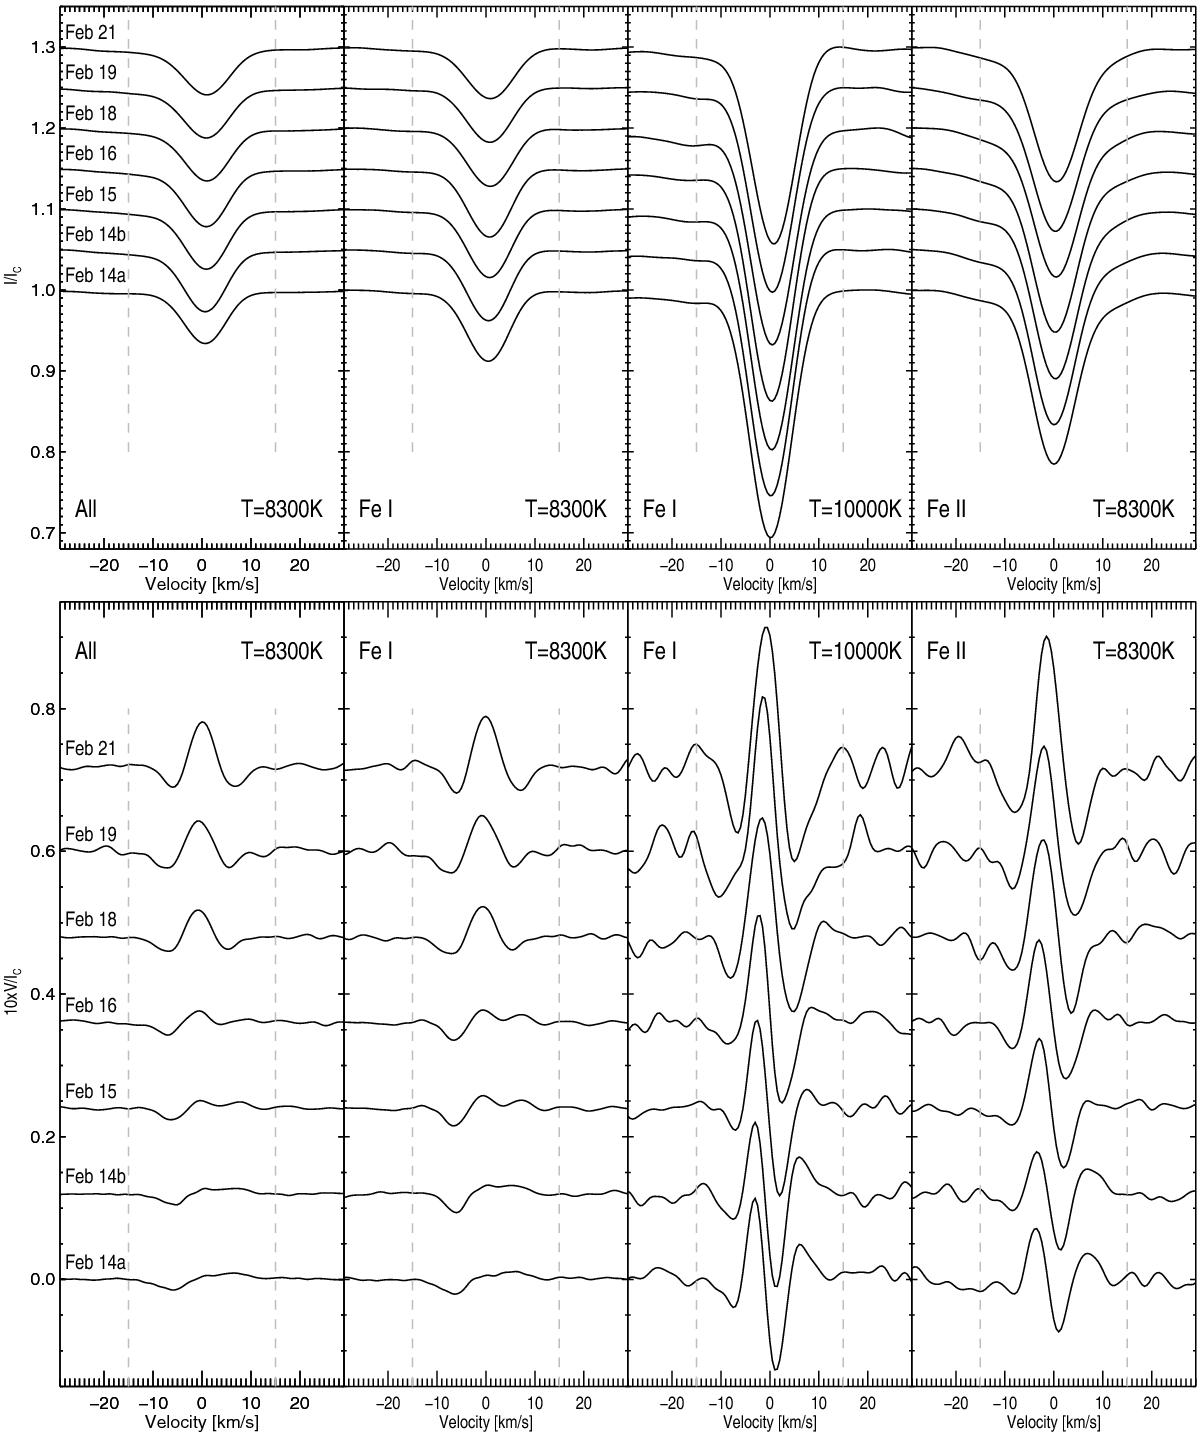
Time series of SVD I (top) and V (bottom) spectra of HD 101412 obtained using different line masks. The profiles are shifted upwards and Stokes V profiles are multiplied by ten for better visibility. From left to right the results correspond to the following line samples: the sample of 650 lines belonging to various iron-peak elements assuming Teff = 8300 K, the sample of 339 Fe i lines (Teff = 8300 K), the sample of 29 Fe i lines assuming Teff = 10 000 K, and the sample of 52 Fe ii lines (Teff = 8300 K). The vertical dashed lines indicate the velocity interval used for the magnetic field measurements.
Current usage metrics show cumulative count of Article Views (full-text article views including HTML views, PDF and ePub downloads, according to the available data) and Abstracts Views on Vision4Press platform.
Data correspond to usage on the plateform after 2015. The current usage metrics is available 48-96 hours after online publication and is updated daily on week days.
Initial download of the metrics may take a while.