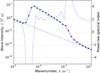
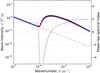
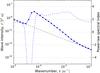
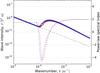
Fig. 4
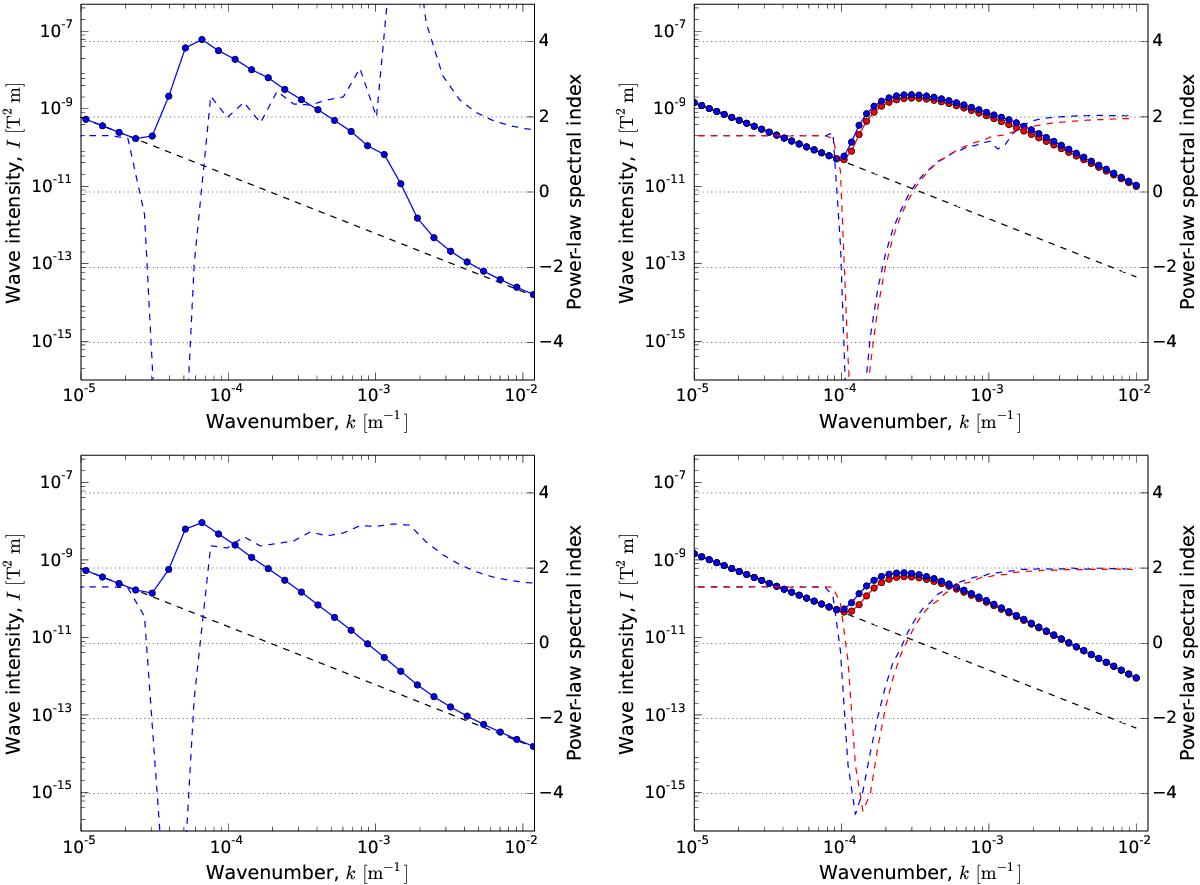
Wave intensity spectra obtained with CSA (left column) and SOLPACS (right column) for ϵinj = 1.62 × 10⁻⁵ at distance x = 0.0035 R⊙ (top row) and x = 0.13 R⊙ (bottom row) in front of the shock at t = 580 s. The filled blue and red circles in the SOLPACS data plots denote wave intensities of Alfvén waves of the opposite circular polarization. In all plots, coloured dashed lines show spectral indices and black dashed line shows the initial spectrum, normalized to provide λ = 1 R⊙ for 100 keV protons.
Current usage metrics show cumulative count of Article Views (full-text article views including HTML views, PDF and ePub downloads, according to the available data) and Abstracts Views on Vision4Press platform.
Data correspond to usage on the plateform after 2015. The current usage metrics is available 48-96 hours after online publication and is updated daily on week days.
Initial download of the metrics may take a while.