Fig. 9
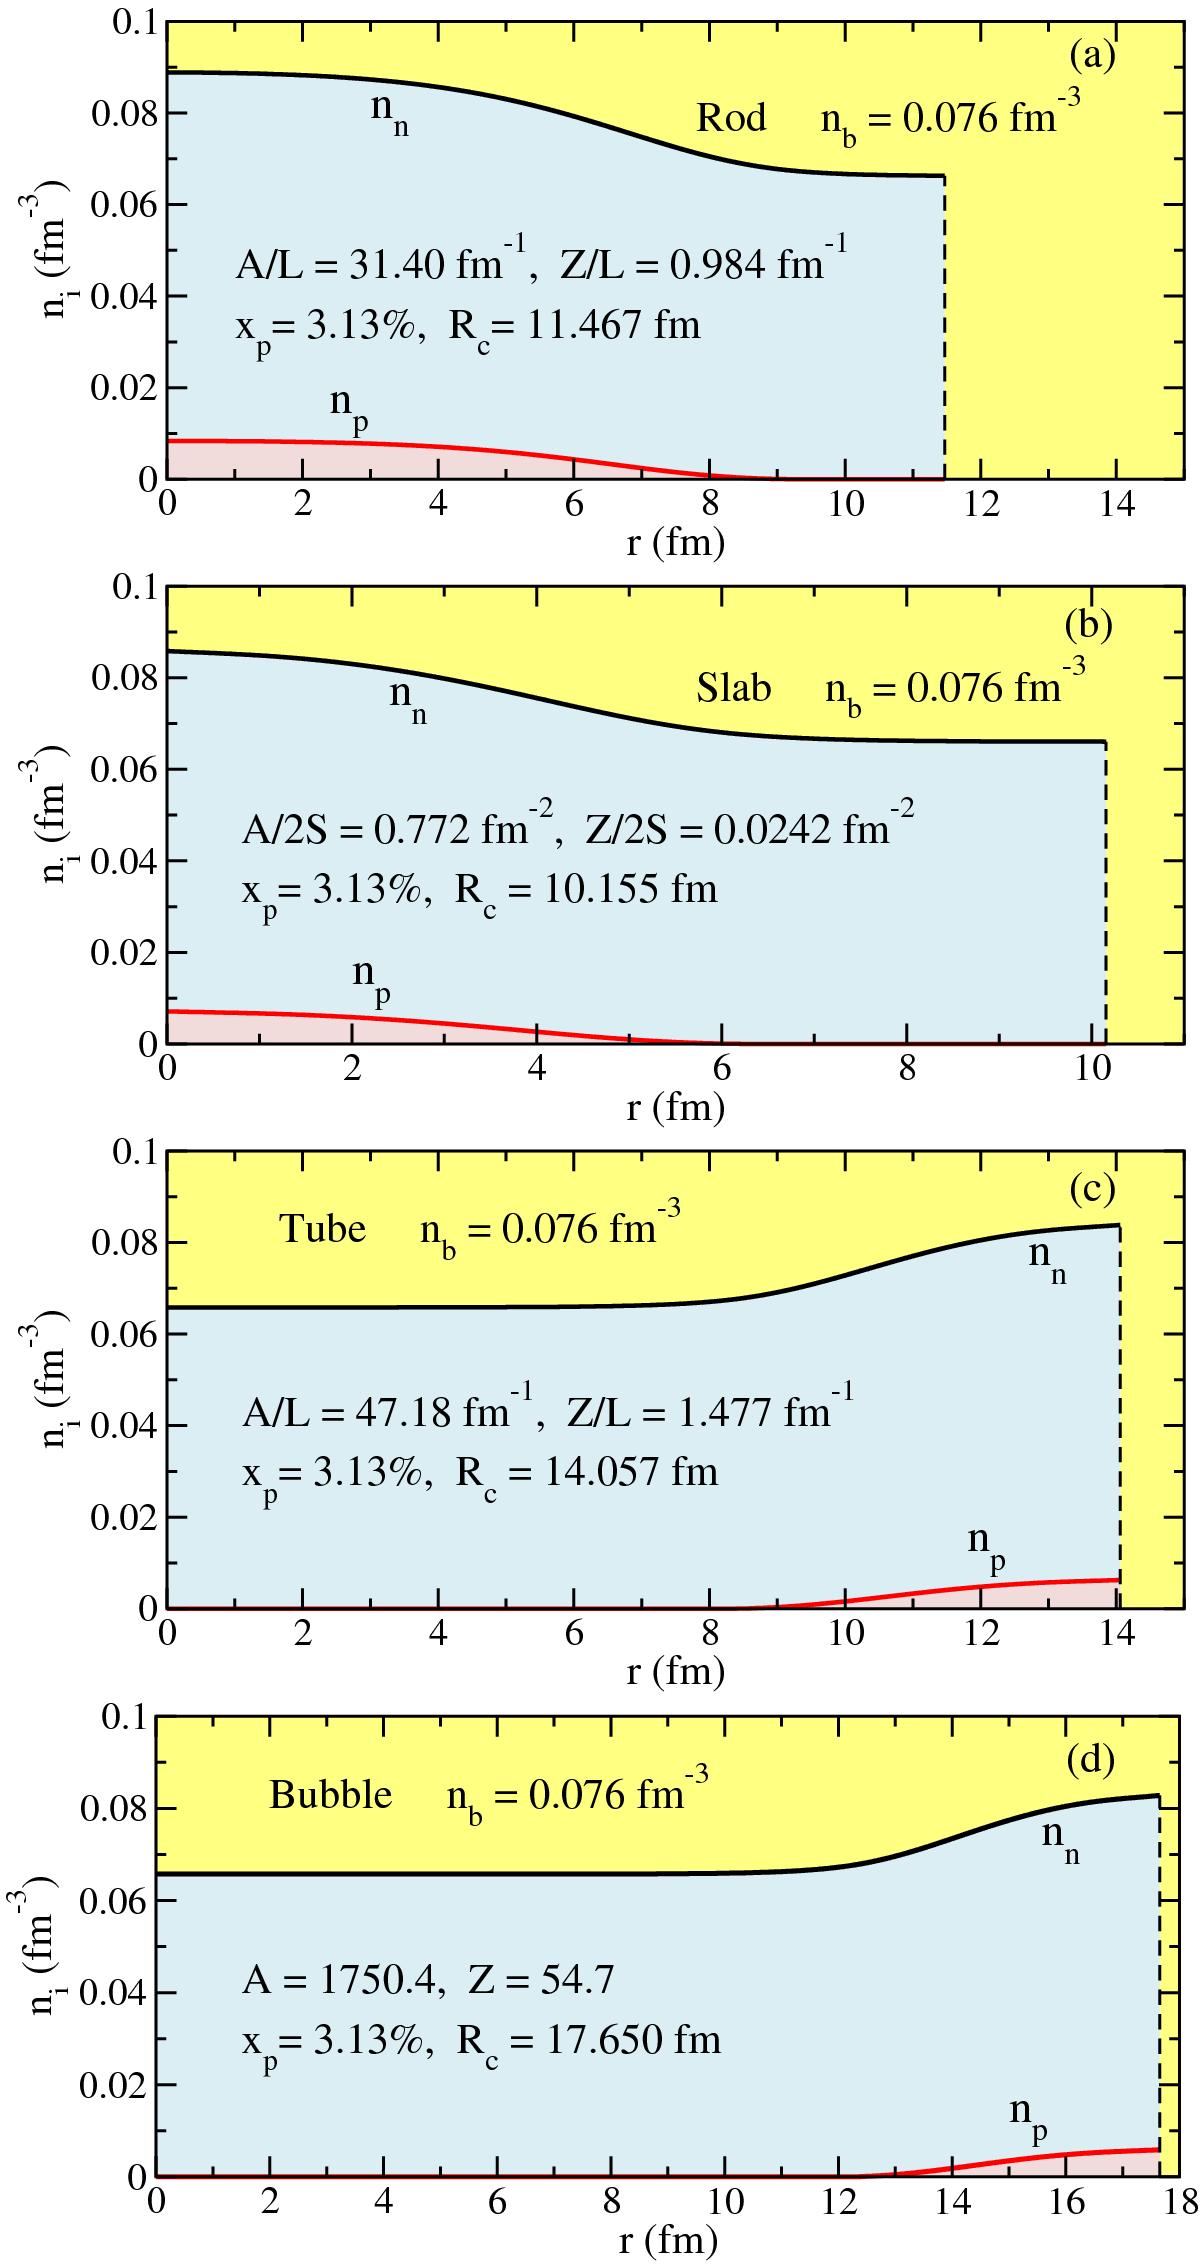
a) Optimal density profile of neutrons nn and protons np for rod shapes at average baryon density nb = 0.076 fm-3. The associated baryon and proton numbers, proton fraction xp = Z/A in percentage, and radius of the cell are shown. The vertical dashed line marks the location of the end of the WS cell. b) The same for slab shapes. c) The same for tube shapes. d) The same for bubble shapes. We note that the scale on the horizontal axis is the same in Figs. 9c and a, and in Figs. 9d and 8c.
Current usage metrics show cumulative count of Article Views (full-text article views including HTML views, PDF and ePub downloads, according to the available data) and Abstracts Views on Vision4Press platform.
Data correspond to usage on the plateform after 2015. The current usage metrics is available 48-96 hours after online publication and is updated daily on week days.
Initial download of the metrics may take a while.