Fig. 9
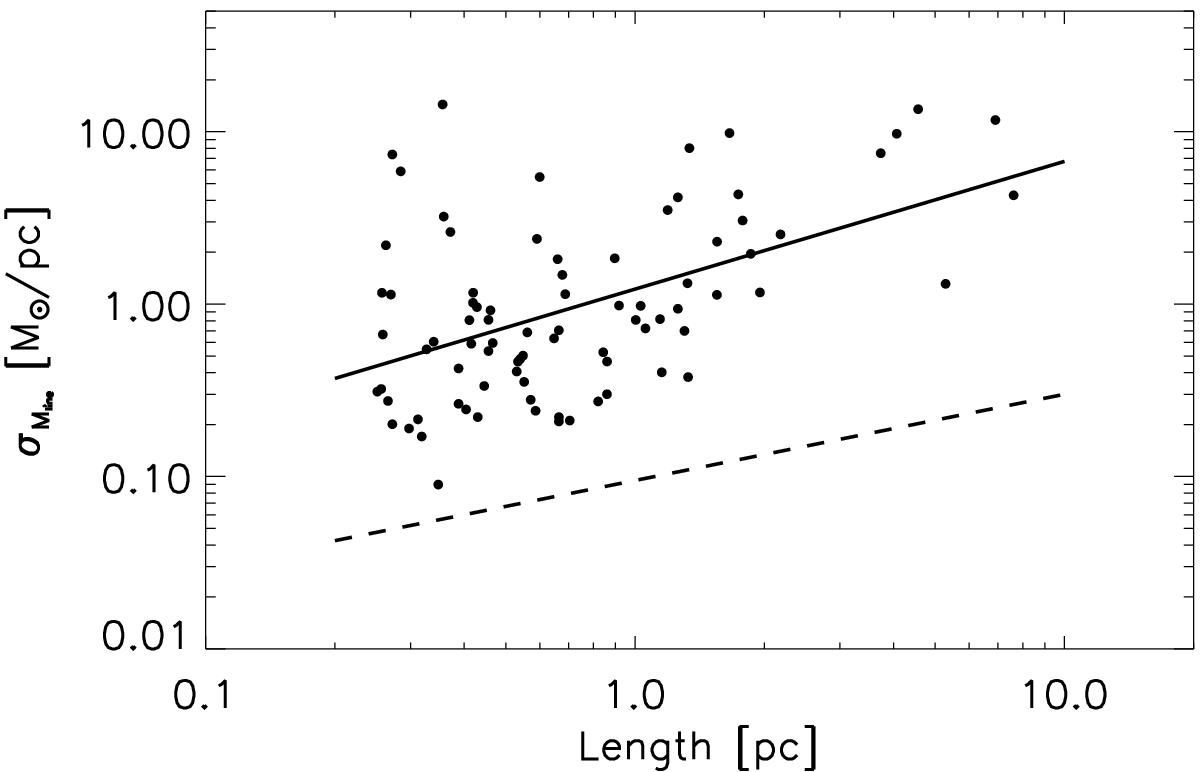
Dispersion of line-mass fluctuations σMline versus projected length L for the filaments in our sample. The solid line shows the best-fit power-law σMline ∝ L0.7 to the data points. For comparison, the dashed line shows a power-law scaling equivalent to the well-known linewidth–size relation in molecular clouds σv ∝ L0.5 (cf. Larson 1981), with an arbitrary normalization.
Current usage metrics show cumulative count of Article Views (full-text article views including HTML views, PDF and ePub downloads, according to the available data) and Abstracts Views on Vision4Press platform.
Data correspond to usage on the plateform after 2015. The current usage metrics is available 48-96 hours after online publication and is updated daily on week days.
Initial download of the metrics may take a while.