Fig. 8
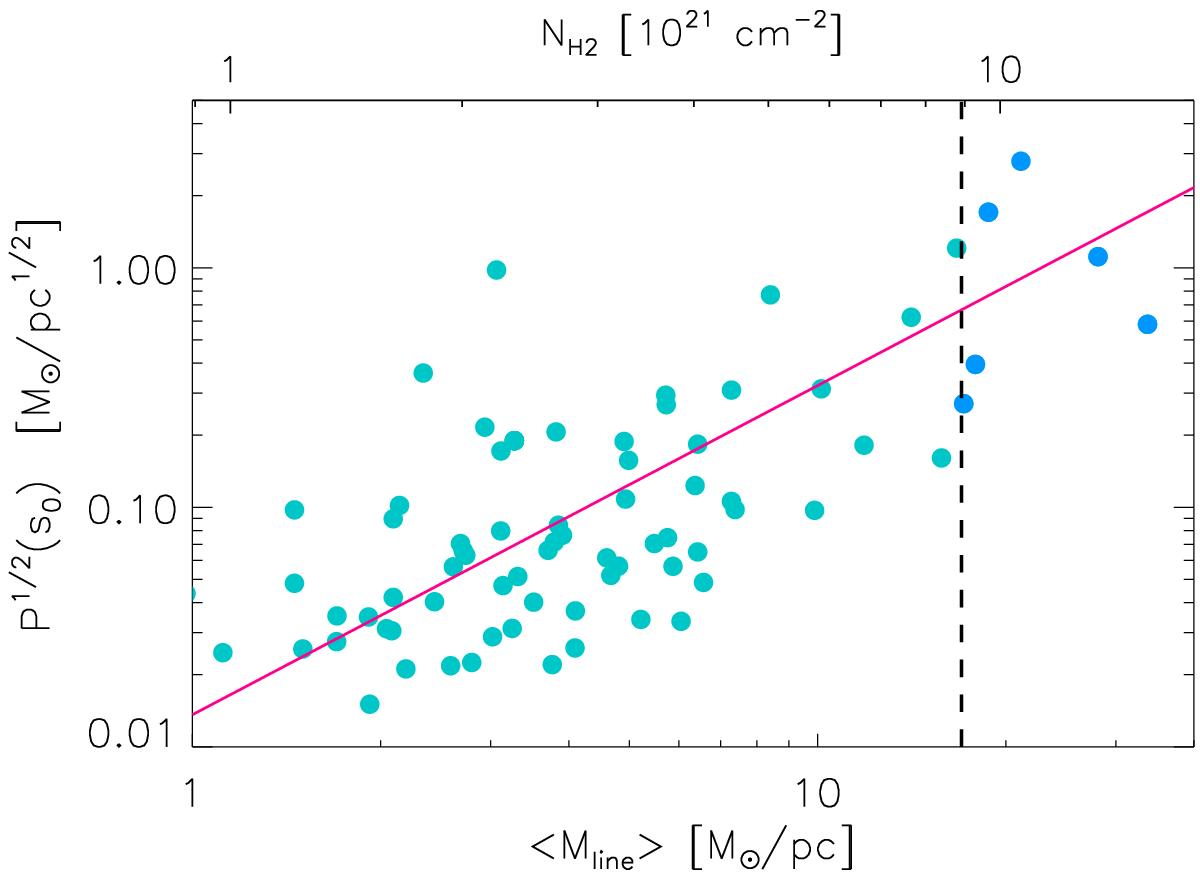
Square root of filament power spectrum amplitude at s0 = 10 pc-1 versus mean line mass of each filament. The solid line shows the best-fit power-law ![]() . The corresponding mean NH2-column density level is shown by the upper coordinate axis. The vertical dashed line separates subcritical filaments (cyan filled circles on the left) from supercritical filaments (blue filled circles on the right). (This figure is available in color in electronic form.)
. The corresponding mean NH2-column density level is shown by the upper coordinate axis. The vertical dashed line separates subcritical filaments (cyan filled circles on the left) from supercritical filaments (blue filled circles on the right). (This figure is available in color in electronic form.)
Current usage metrics show cumulative count of Article Views (full-text article views including HTML views, PDF and ePub downloads, according to the available data) and Abstracts Views on Vision4Press platform.
Data correspond to usage on the plateform after 2015. The current usage metrics is available 48-96 hours after online publication and is updated daily on week days.
Initial download of the metrics may take a while.