Fig. 7
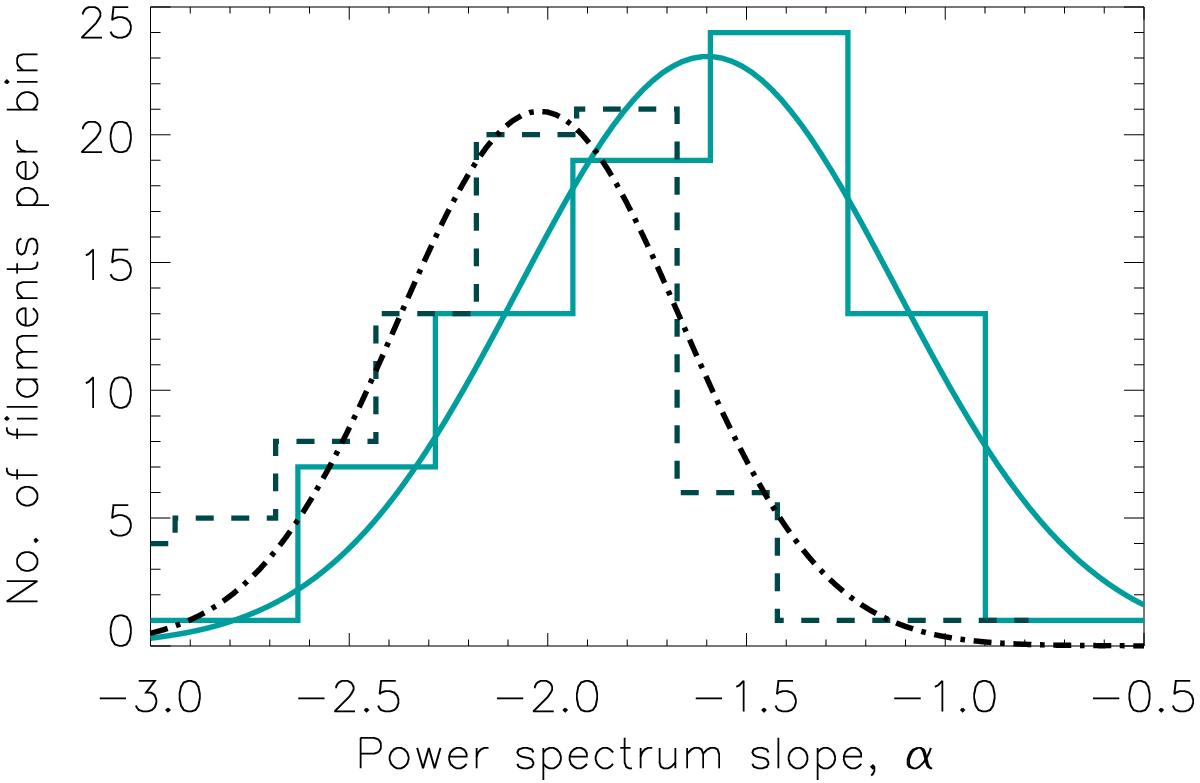
Distributions of power spectrum slopes measured before beam correction (dashed histogram) and after beam correction (solid histogram) for our selected sample of 80 filaments. Best-fit Gaussian curves to the two observed distributions are overplotted. The two distributions are centered on ![]() and
and ![]() for the uncorrected and beam-corrected power spectra, respectively. (This figure is available in color in electronic form.)
for the uncorrected and beam-corrected power spectra, respectively. (This figure is available in color in electronic form.)
Current usage metrics show cumulative count of Article Views (full-text article views including HTML views, PDF and ePub downloads, according to the available data) and Abstracts Views on Vision4Press platform.
Data correspond to usage on the plateform after 2015. The current usage metrics is available 48-96 hours after online publication and is updated daily on week days.
Initial download of the metrics may take a while.