Fig. 6
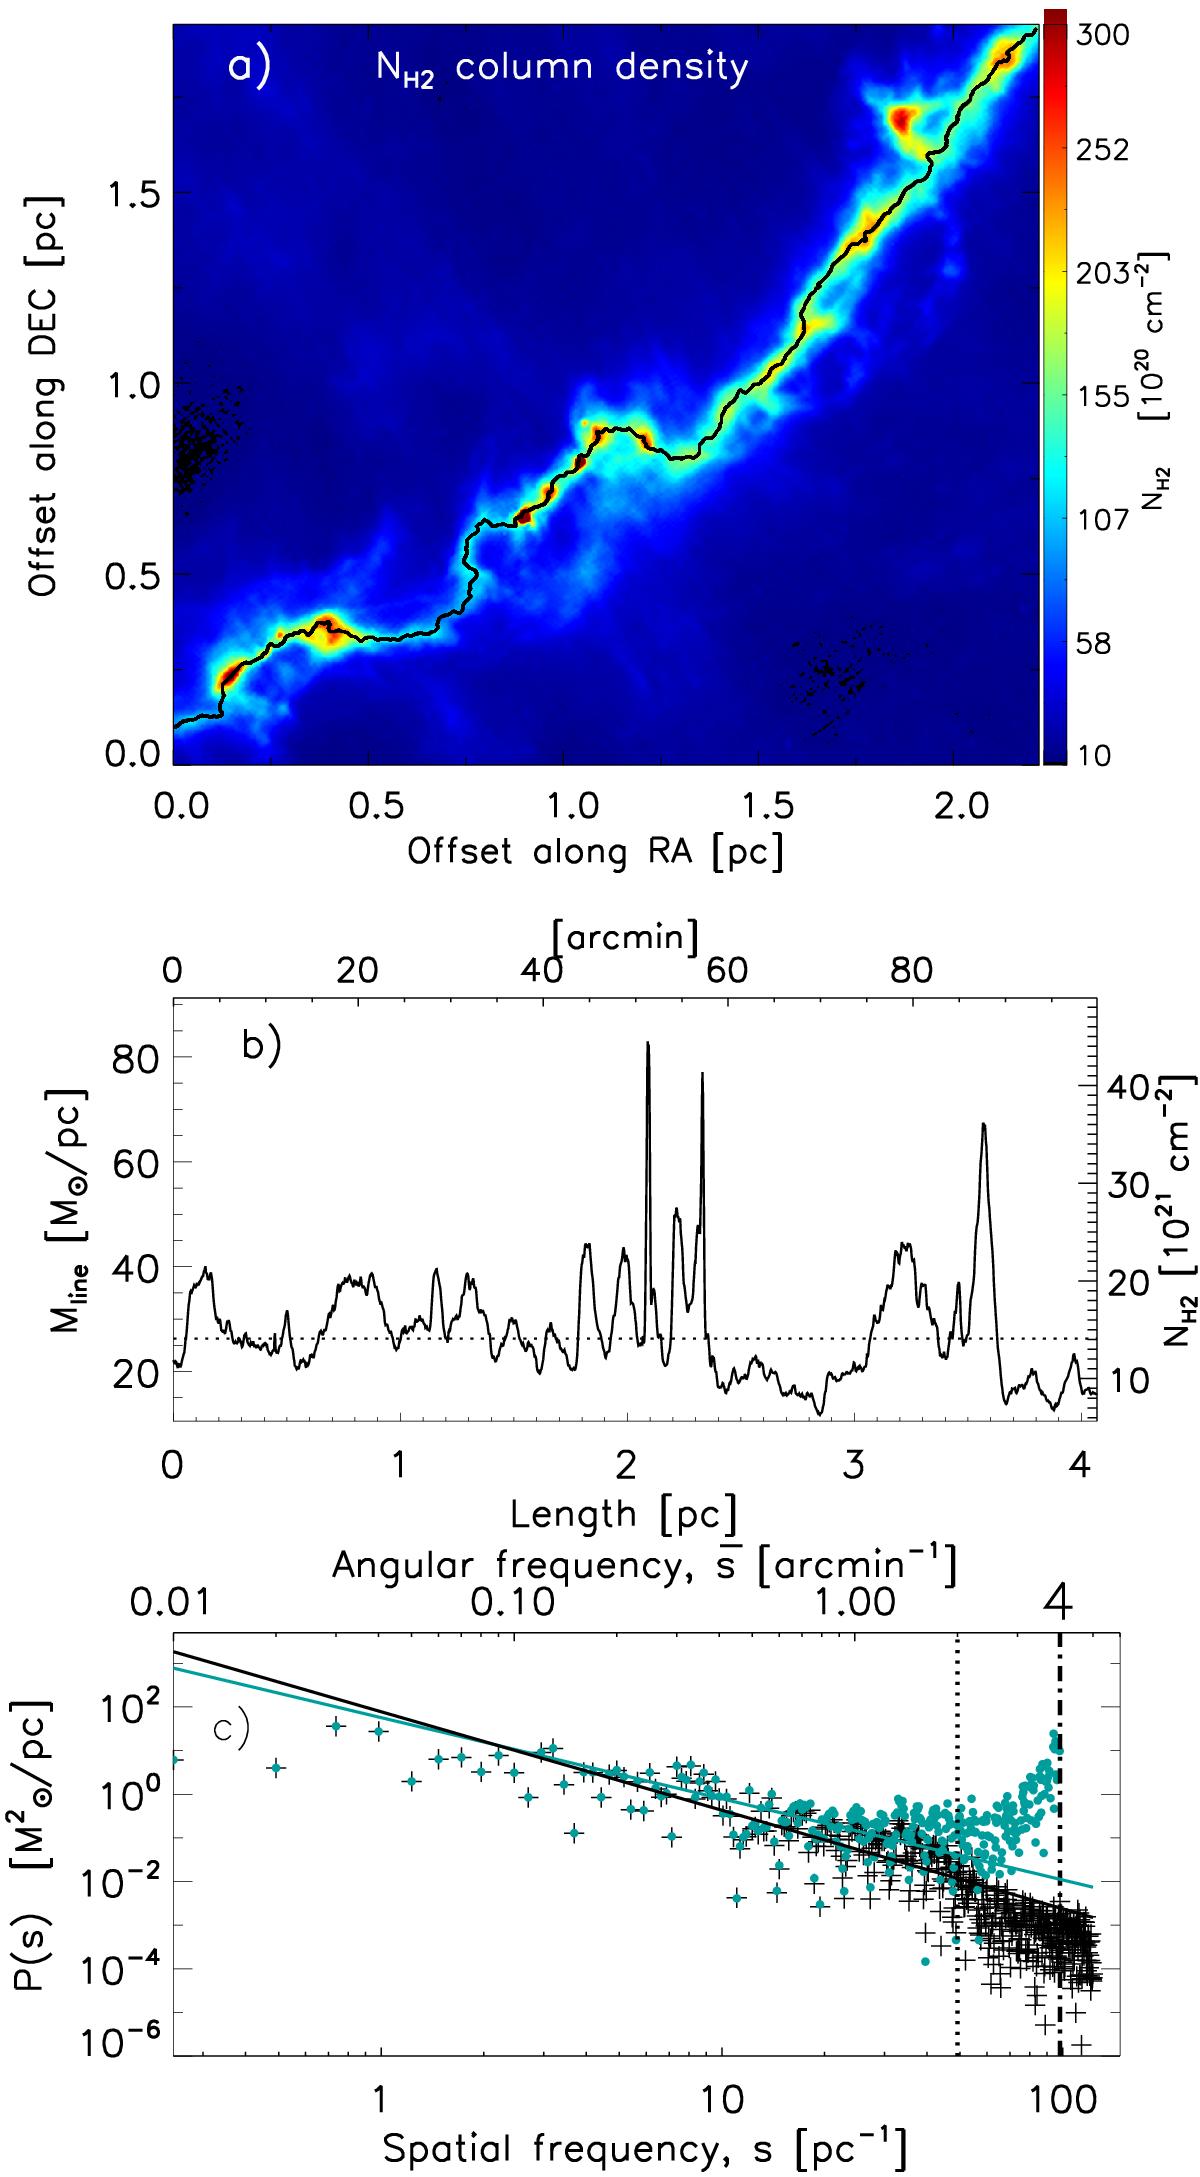
Similar to Fig. 5, but for the thermally supercritical filament B211/B213 in the Taurus cloud at d ~ 140 pc (cf. Palmeirim et al. 2013). The mean line mass of the filament is ⟨Mline⟩ ~ 30M⊙/pc ≫Mline,crit, as shown by the dotted horizontal line in panel b). The median relative amplitude of the line-mass fluctuations is ![]() . We note the spike features corresponding to the positions of dense cores along the filament and capturing non-linear density perturbations. In panel c), the power-law fits to the power spectra Pobs(s) and Ptrue(s) have logarithmic slopes −2.2 ± 0.2 and −1.9 ± 0.3, respectively. The best power-law fit to Ptrue(s) is unchanged if only angular frequencies up to
. We note the spike features corresponding to the positions of dense cores along the filament and capturing non-linear density perturbations. In panel c), the power-law fits to the power spectra Pobs(s) and Ptrue(s) have logarithmic slopes −2.2 ± 0.2 and −1.9 ± 0.3, respectively. The best power-law fit to Ptrue(s) is unchanged if only angular frequencies up to ![]() = 1.5 arcmin-1 are considered. (This figure is available in color in electronic form.)
= 1.5 arcmin-1 are considered. (This figure is available in color in electronic form.)
Current usage metrics show cumulative count of Article Views (full-text article views including HTML views, PDF and ePub downloads, according to the available data) and Abstracts Views on Vision4Press platform.
Data correspond to usage on the plateform after 2015. The current usage metrics is available 48-96 hours after online publication and is updated daily on week days.
Initial download of the metrics may take a while.