Fig. 5
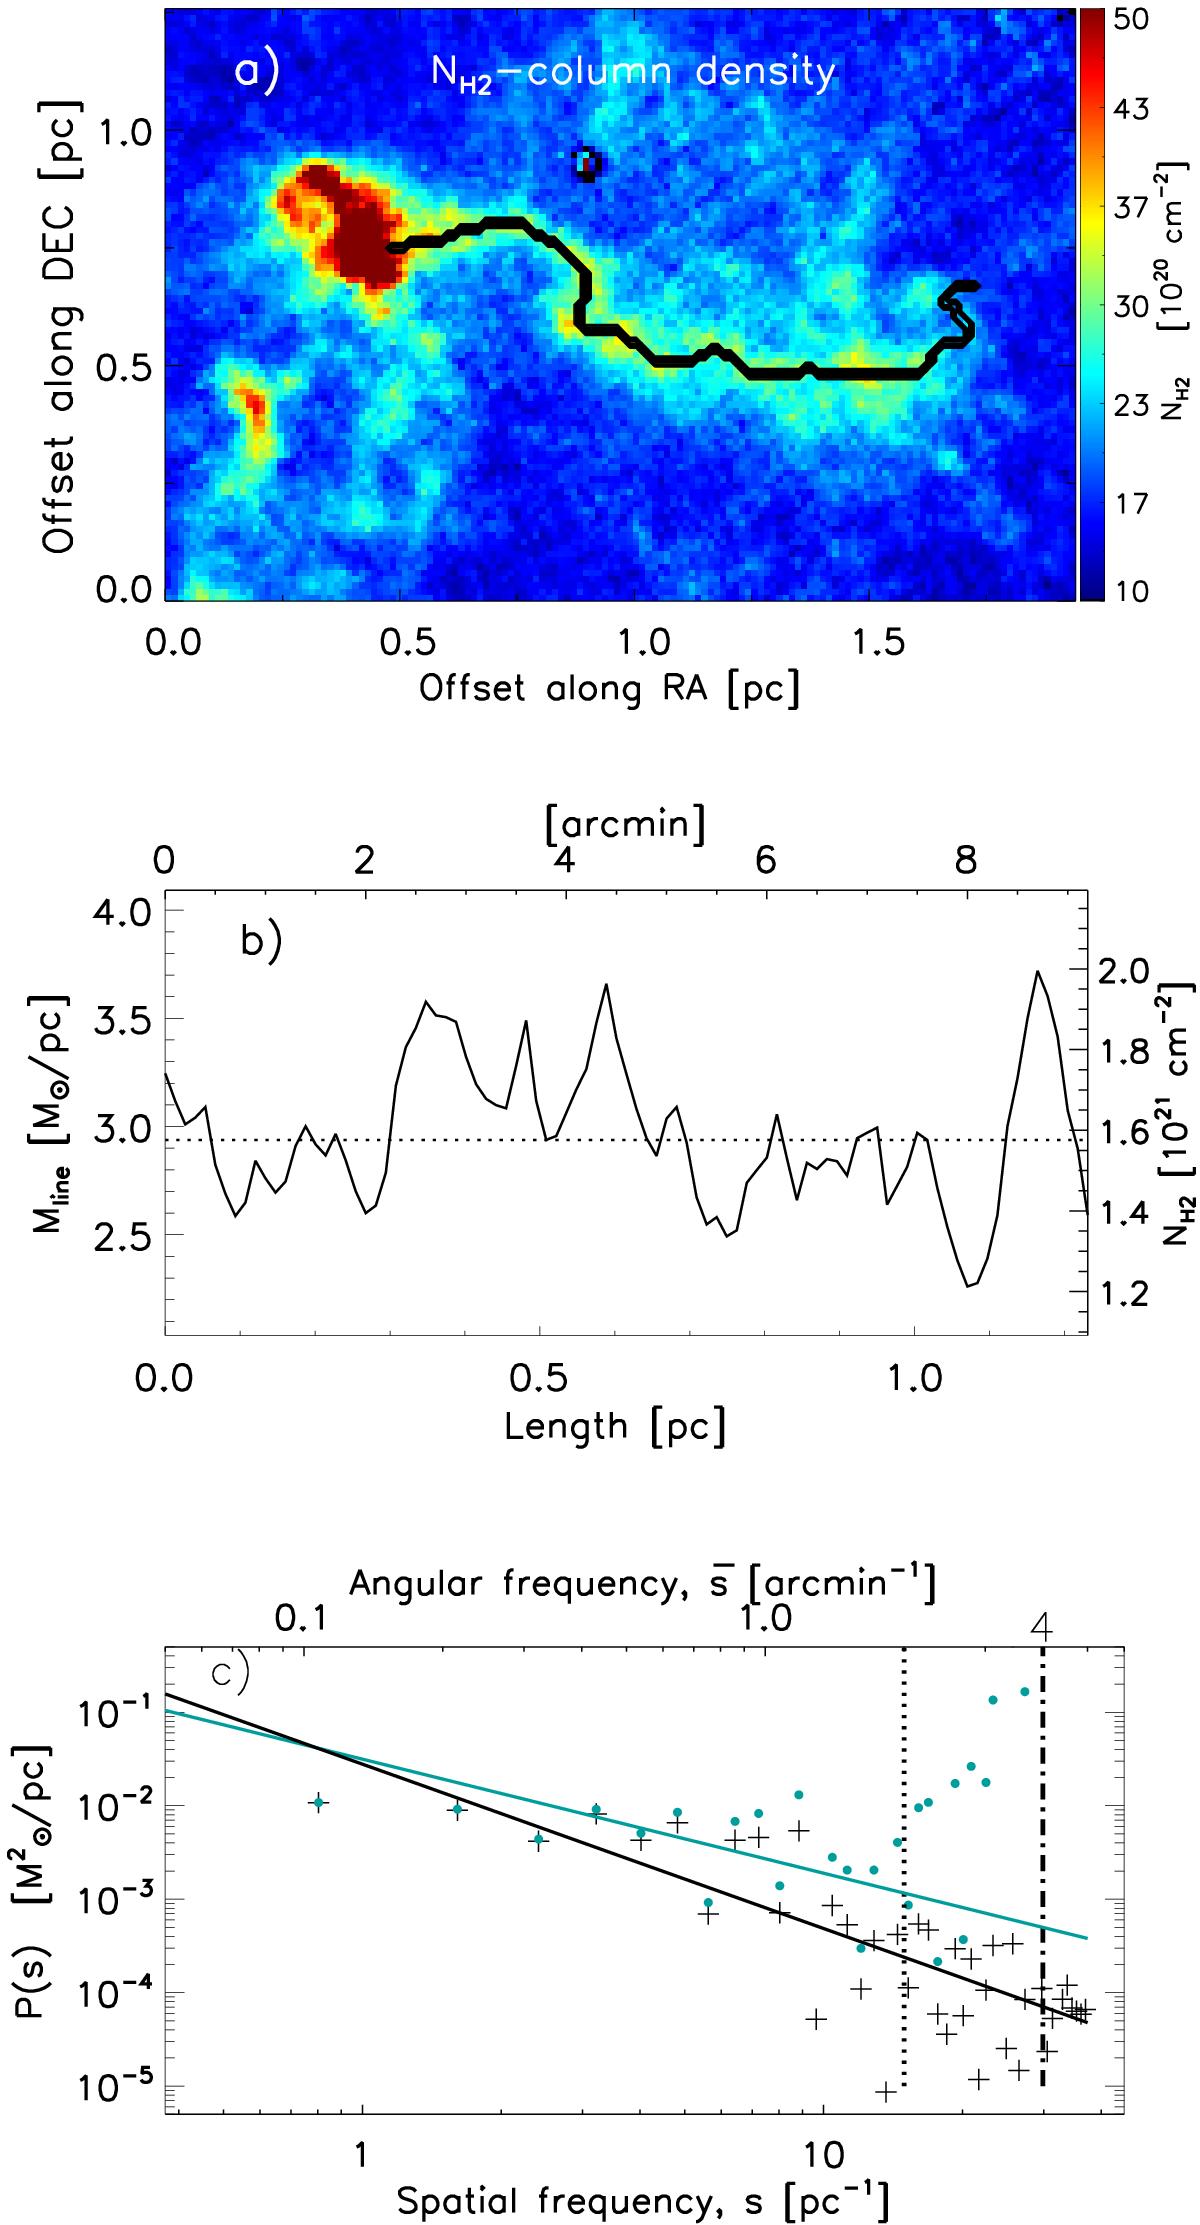
Panels a) and b) are similar to Figs. 2a and b, but for an example of a thermally subcritical filament in the IC 5146 molecular cloud (d ~ 460 pc). The mean line mass of the filament is ⟨Mline⟩ ~ 3M⊙/pc ≪Mline,crit, as shown by the dotted horizontal line in panel (b). The median relative amplitude of the line-mass fluctuations is ![]() , within the linear perturbation regime. Panel c) is similar to Fig. 4 but for the IC 5146 filament. The power-law fits to the power spectra Pobs(s) and Ptrue(s) have logarithmic slopes −1.8 ± 0.2 and −1.2 ± 0.4, respectively. Considering only angular frequencies up to
, within the linear perturbation regime. Panel c) is similar to Fig. 4 but for the IC 5146 filament. The power-law fits to the power spectra Pobs(s) and Ptrue(s) have logarithmic slopes −1.8 ± 0.2 and −1.2 ± 0.4, respectively. Considering only angular frequencies up to ![]() = 1.5 arcmin-1, the best power-law fit to Ptrue(s) has a slope αtrue = −1.1 ± 0.3. (This figure is available in color in electronic form.)
= 1.5 arcmin-1, the best power-law fit to Ptrue(s) has a slope αtrue = −1.1 ± 0.3. (This figure is available in color in electronic form.)
Current usage metrics show cumulative count of Article Views (full-text article views including HTML views, PDF and ePub downloads, according to the available data) and Abstracts Views on Vision4Press platform.
Data correspond to usage on the plateform after 2015. The current usage metrics is available 48-96 hours after online publication and is updated daily on week days.
Initial download of the metrics may take a while.