Fig. 4
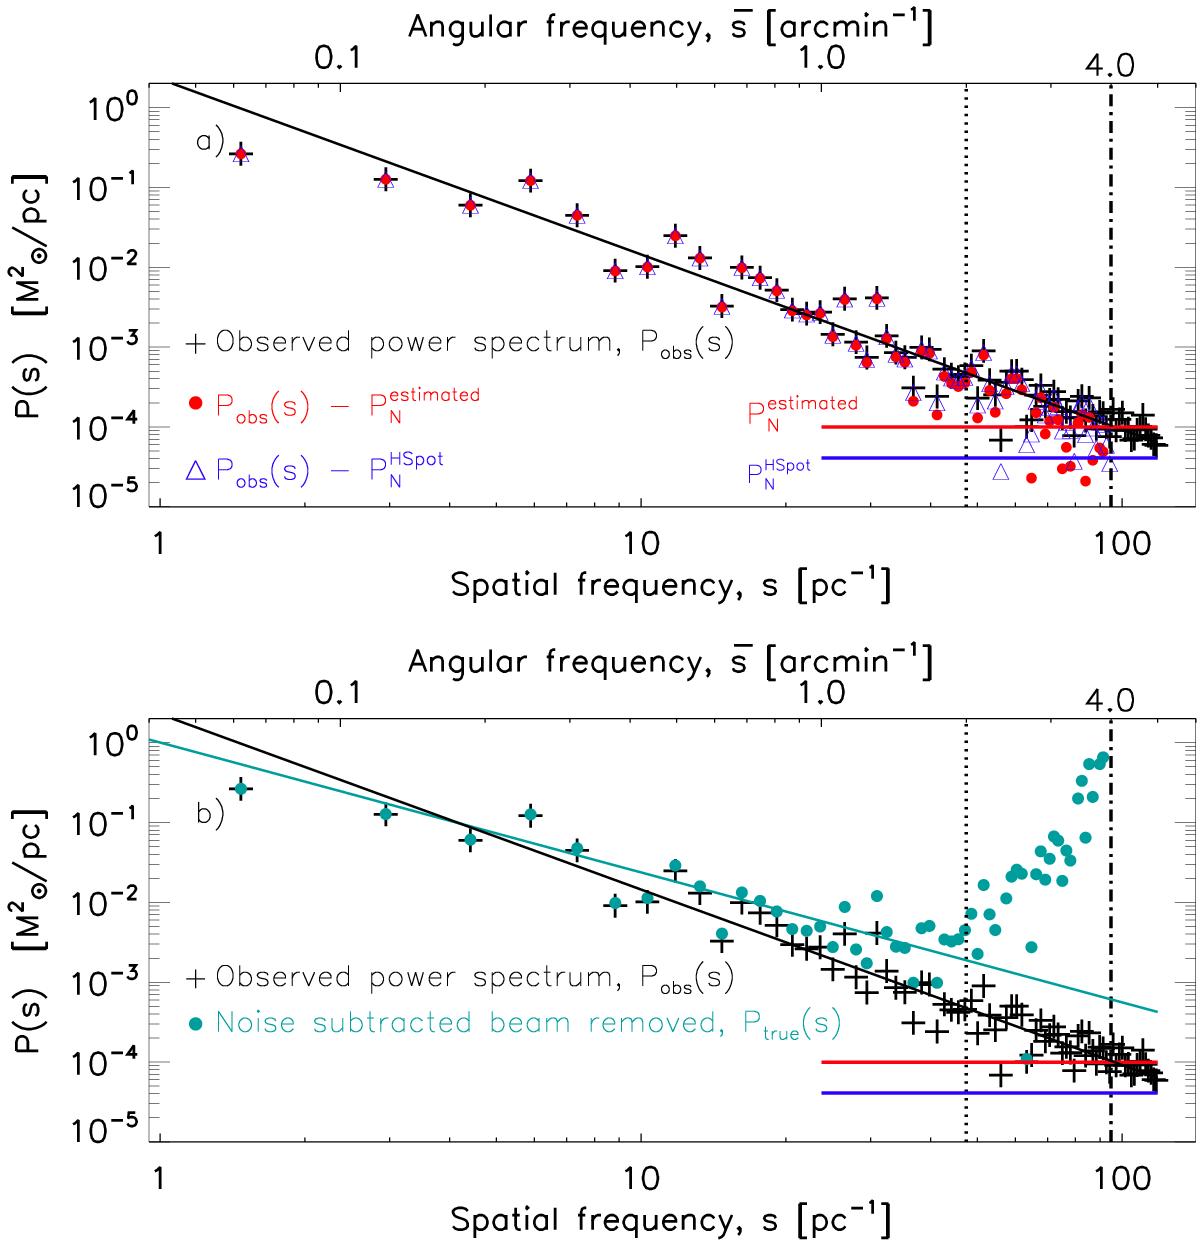
Power spectrum of the line-mass fluctuations observed along the Pipe filament shown in Fig. 2 as a function of spatial frequency s (bottom x-axis) or angular frequency ![]() (top x-axis). In both panels, the black plus symbols show the observed power spectrum, Pobs(s). In panel a), the red dots show the power spectrum, Pobs(s)−PN, obtained after subtracting a white noise power spectrum level
(top x-axis). In both panels, the black plus symbols show the observed power spectrum, Pobs(s). In panel a), the red dots show the power spectrum, Pobs(s)−PN, obtained after subtracting a white noise power spectrum level ![]() ×10-4M⊙2/pc, marked by the horizontal red line and estimated from the median value of Pobs(s) in the 3.9–4.2 arcmin-1 angular frequency range; the blue triangles show a similar power spectrum after subtracting the instrument noise power spectrum level
×10-4M⊙2/pc, marked by the horizontal red line and estimated from the median value of Pobs(s) in the 3.9–4.2 arcmin-1 angular frequency range; the blue triangles show a similar power spectrum after subtracting the instrument noise power spectrum level ![]() 4.0 ×10⁻⁵M⊙2/pc, marked by the horizontal blue line and corresponding to the instrument noise level 1σ ~ 1 MJy/sr in our SPIRE 250 μm maps according to HSpot3. In panel b), the cyan dots show the noise-subtracted and beam-corrected power spectrum, Ptrue(s) = (Pobs(s)−PN) /γbeam. The vertical dotted line in both panels marks the FWHM of the beam power spectrum at 250 μm (
4.0 ×10⁻⁵M⊙2/pc, marked by the horizontal blue line and corresponding to the instrument noise level 1σ ~ 1 MJy/sr in our SPIRE 250 μm maps according to HSpot3. In panel b), the cyan dots show the noise-subtracted and beam-corrected power spectrum, Ptrue(s) = (Pobs(s)−PN) /γbeam. The vertical dotted line in both panels marks the FWHM of the beam power spectrum at 250 μm (![]() arcmin-1; see Fig. A.1), which is also the highest frequency data point used to fit a power-law function. The vertical dot-dashed line is the Nyquist angular frequency (λ/ 2D) for SPIRE 250 μm data. The power-law fits to the power spectra Pobs(s) and Ptrue(s) have logarithmic slopes αobs = −2.1 ± 0.2 and αtrue = −1.6 ± 0.2, respectively. Considering only angular frequencies up to
arcmin-1; see Fig. A.1), which is also the highest frequency data point used to fit a power-law function. The vertical dot-dashed line is the Nyquist angular frequency (λ/ 2D) for SPIRE 250 μm data. The power-law fits to the power spectra Pobs(s) and Ptrue(s) have logarithmic slopes αobs = −2.1 ± 0.2 and αtrue = −1.6 ± 0.2, respectively. Considering only angular frequencies up to ![]() = 1.5 arcmin-1, the best power-law fit to Ptrue(s) becomes αtrue = −1.7 ± 0.3. (This figure is available in color in electronic form.)
= 1.5 arcmin-1, the best power-law fit to Ptrue(s) becomes αtrue = −1.7 ± 0.3. (This figure is available in color in electronic form.)
Current usage metrics show cumulative count of Article Views (full-text article views including HTML views, PDF and ePub downloads, according to the available data) and Abstracts Views on Vision4Press platform.
Data correspond to usage on the plateform after 2015. The current usage metrics is available 48-96 hours after online publication and is updated daily on week days.
Initial download of the metrics may take a while.