Fig. 3
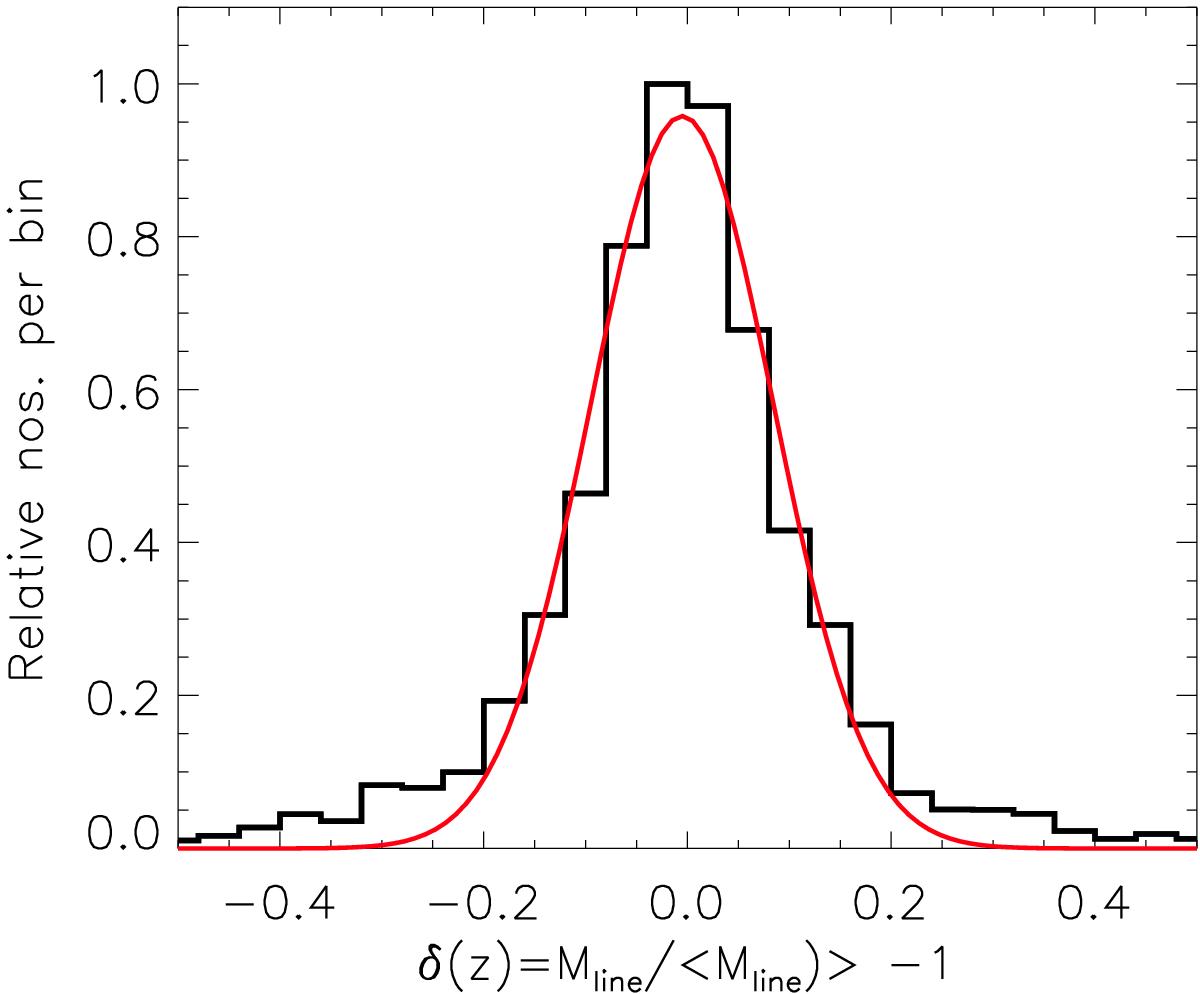
Normalized histogram showing the probability distribution of relative line-mass fluctuations along the long axes of the subset of 67 filaments, which are entirely subcritical. The red curve shows the Gaussian best fit to the observed distribution, which has a mean of ~0 and a standard deviation of ~0.09. (This figure is available in color in electronic form.)
Current usage metrics show cumulative count of Article Views (full-text article views including HTML views, PDF and ePub downloads, according to the available data) and Abstracts Views on Vision4Press platform.
Data correspond to usage on the plateform after 2015. The current usage metrics is available 48-96 hours after online publication and is updated daily on week days.
Initial download of the metrics may take a while.