Fig. 2
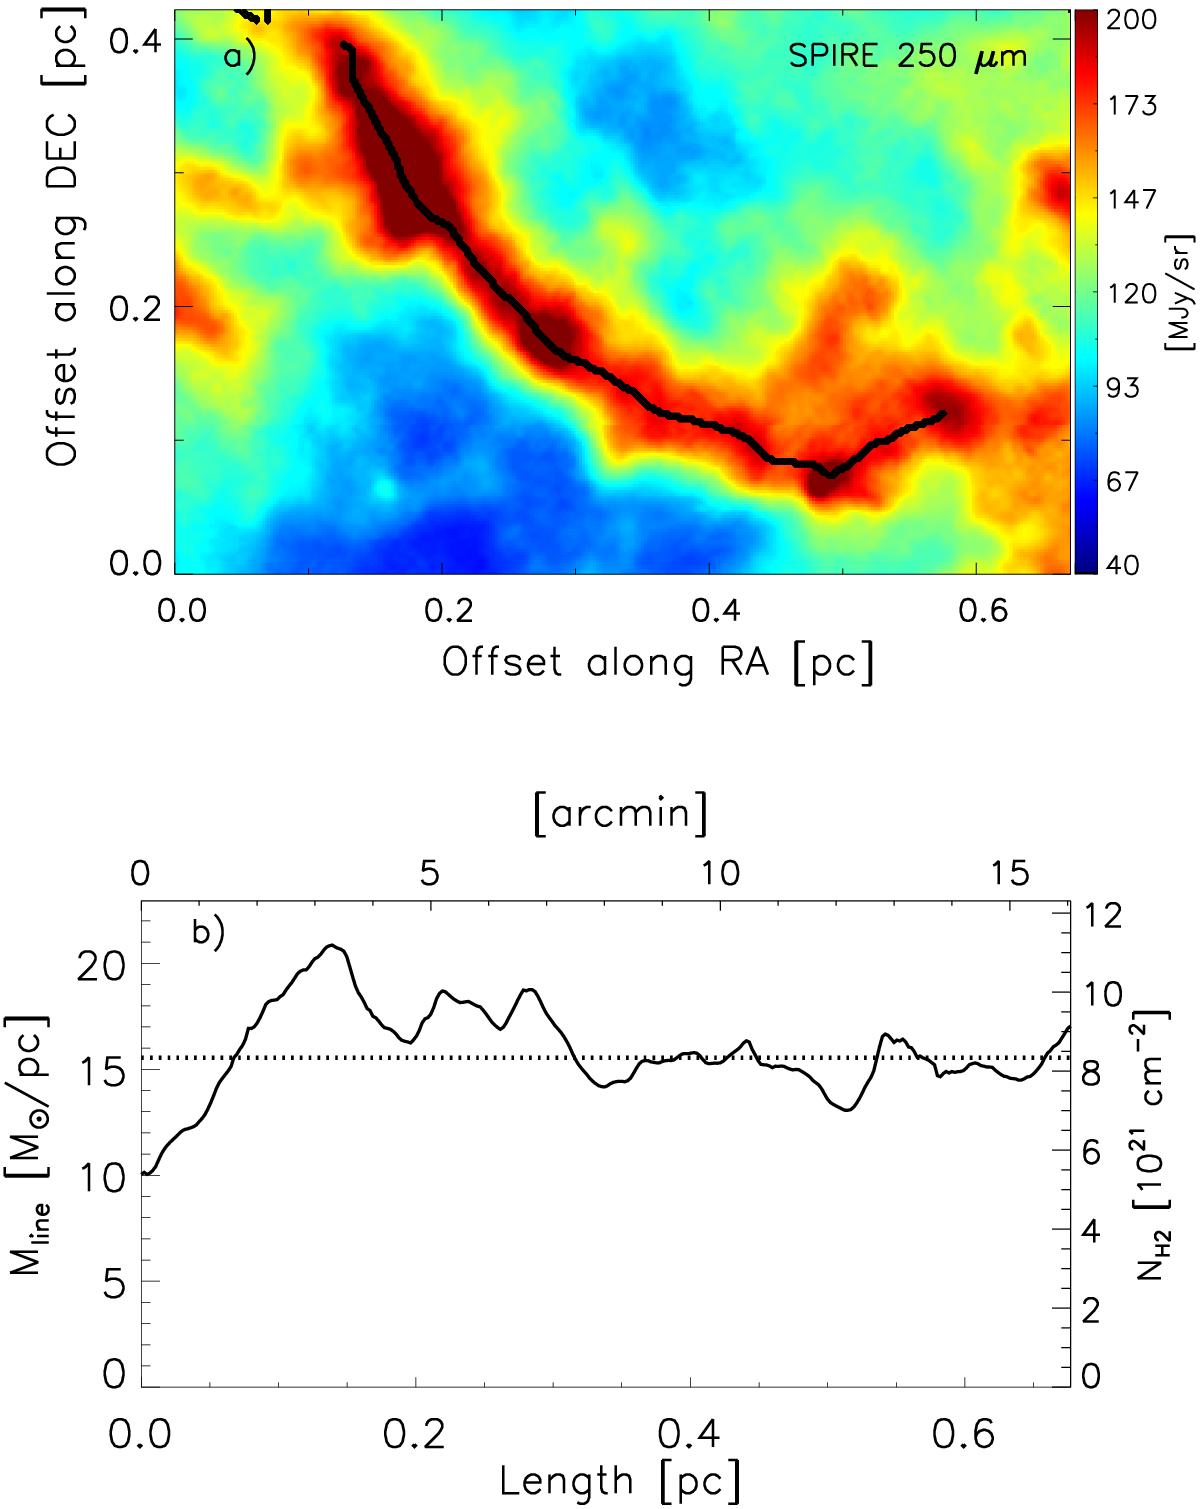
Close-up view of the sub-region indicated by the black dashed rectangle in Fig. 1 showing a) an example of a nearly critical filament in the Pipe cloud at an adopted distance d = 145 pc and b) the line-mass/column density fluctuations along the long axis of the same filament, both at the 18.̋2 (HPBW) resolution of the SPIRE 250 μm data. The black curve in a) shows the crest of the filament as traced by the DisPerSE algorithm (cf. Sousbie et al. 2011). In b) the right ordinate axis shows the net H2-column density fluctuations along the filament. Equivalent line-mass values (assuming a characteristic filament width of 0.1 pc) are indicated on the left ordinate axis. A constant background column density level was subtracted before deriving the line mass fluctuations. The dotted horizontal line marks the mean line mass of the filament, ⟨Mline⟩ ~ 15 M⊙/pc, which is only slightly lower than critical line mass of 16.3 M⊙/pc for an isothermal cylinder at 10 K. The median relative amplitude of the line-mass fluctuations is ![]() , within the linear perturbation regime. The maximum relative amplitude is ~0.3 ≪ 1. (This figure is available in color in electronic form.)
, within the linear perturbation regime. The maximum relative amplitude is ~0.3 ≪ 1. (This figure is available in color in electronic form.)
Current usage metrics show cumulative count of Article Views (full-text article views including HTML views, PDF and ePub downloads, according to the available data) and Abstracts Views on Vision4Press platform.
Data correspond to usage on the plateform after 2015. The current usage metrics is available 48-96 hours after online publication and is updated daily on week days.
Initial download of the metrics may take a while.