| Issue |
A&A
Volume 584, December 2015
|
|
|---|---|---|
| Article Number | A118 | |
| Number of page(s) | 11 | |
| Section | Interstellar and circumstellar matter | |
| DOI | https://doi.org/10.1051/0004-6361/201526280 | |
| Published online | 03 December 2015 | |
Herschel HIFI observations of the Sgr A +50 km s-1 Cloud⋆
Deep searches for O2 in emission and foreground absorption
1 Stockholm Observatory, Stockholm University, AlbaNova University Center 106 91 Stockholm Sweden
e-mail:
aage@astro.su.se
2 Department of Earth and Space Sciences, Chalmers University of Technology, Onsala Space Observatory, 429 92 Onsala, Sweden
3 LERMA, Observatoire de Paris, PSL Research University, CNRS, Sorbonne Universités, UPMC Univ. Paris 06, 75014 Paris, France
4 LERMA, Observatoire de Paris, PSL Research University, CNRS, Sorbonne Universités, UPMC Univ. Paris 06, École Normale Supérieure, 75005 Paris, France
5 Jet Propulsion Laboratory, California Institute of Technology, 4800 Oak Grove Drive, Pasadena CA 91109, USA
6 California Institute of Technology, Cahill Center for Astronomy and Astrophysics 301-17, Pasadena, CA 91125, USA
7 LERMA, Observatoire de Paris, PSL Research University, CNRS, Sorbonne Universités, UPMC Univ. Paris 06, 92190 Meudon, France
8 Department of Physics and Astronomy, University College London, London WC1E 6BT, UK
Received: 8 April 2015
Accepted: 18 October 2015
Context. The Herschel Oxygen Project (HOP) is an open time key program, awarded 140 h of observing time to search for molecular oxygen (O2) in a number of interstellar sources. To date O2 has definitely been detected in only two sources, namely ρ Oph A and Orion, reflecting the extremely low abundance of O2 in the interstellar medium.
Aims. One of the sources in the HOP program is the +50 km s-1 Cloud in the Sgr A Complex in the centre of the Milky Way. Its environment is unique in the Galaxy and this property is investigated to see if it is conducive to the presence of O2.
Methods. The Herschel Heterodyne Instrument for the Far Infrared (HIFI) is used to search for the 487 and 774 GHz emission lines of O2.
Results. No O2 emission is detected towards the Sgr A +50 km s-1 Cloud, but a number of strong emission lines of methanol (CH3OH) and absorption lines of chloronium (H2Cl+) are observed.
Conclusions. A 3σ upper limit for the fractional abundance ratio of [O2]/[H2] in the Sgr A +50 km s-1 Cloud is found to be X(O2) ≤ 5 × 10⁻⁸. However, since we can find no other realistic molecular candidate than O2 itself, we very tentatively suggest that two weak absorption lines at 487.261 and 487.302 GHz may be caused by the 487 GHz line of O2 in two foreground spiral arm clouds. By considering that the absorption may only be apparent, the estimated upper limit to the O2 abundance of ≤ (10−20) × 10-6 in these foreground clouds is very high, as opposed to the upper limit in the Sgr A +50 km s-1 Cloud itself, but similar to what has been reached in recent chemical shock models for Orion. This abundance limit was determined also using Odin non-detection limits, and assumes that O2 fills the beam. If the absorption is due to a differential Herschel OFF-ON emission, the O2 fractional abundance may be of the order of ≈ (5−10) × 10-6. With the assumption of pure absorption by foreground clouds, the unreasonably high abundance of (1.4−2.8) × 10-4 was obtained. The rotation temperatures for CH3OH-A and CH3OH-E lines in the +50 km s-1 Cloud are found to be ≈ 64 and 79 K, respectively, and the fractional abundance of CH3OH is approximately 5 × 10⁻⁷.
Key words: Galaxy: center / ISM: individual objects: Sgr A / ISM: molecules / ISM: clouds
© ESO, 2015
1. Introduction
The core of the Milky Way Galaxy is a region of great complexity containing a wide variety of physical environments. At the very centre resides a four-million-solar-mass supermassive black hole, whose non-thermal radio continuum signature is called Sgr A∗. Orbiting around it, at a distance of one to a few pc, with a velocity of about 100 km s-1, is a molecular torus called the circum nuclear disk (CND). The CND has a mass of 104 to 105M⊙ and a gas temperature of several hundred degrees. Beyond this, there exists a large molecular belt, consisting predominantly of two giant molecular clouds (GMC)s, called the +50 and the +20 km s-1 Clouds. Both GMCs are massive, about 5 × 10⁵M⊙, with a density of 104−105 cm-3, a gas temperature of 80−100 K, and a dust temperature of 20−30 K (e.g. Sandqvist et al. 2008). The +50 km s-1 Cloud, as depicted in the CS molecule, is shown in Fig. 1. A giant energetic (> 1052 erg) supernova remnant (SNR)-like nonthermal continuum radio shell (diameter about 8 pc), known as Sgr A East, is plowing into this molecular belt from the side near Sgr A∗, creating regions of shock interaction, especially at the inner western surface of the +50 km s-1 Cloud. Near the opposite eastern side of the +50 km s-1 Cloud four compact H ii regions exist, named A – D by Ekers et al. (1983). General reviews of the Galactic centre have been presented by e.g. Mezger et al. (1996) and Morris & Serabyn (1996), with an up-to-date introduction to the Sgr A Complex given by Ferrière (2012).
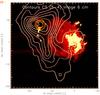 |
Fig. 1 Sgr A +50 km s-1 Cloud, delineated by the integrated emission (+20 to +80 km s-1) in the CS(5−4) line (contours), superimposed upon a 6 cm continuum map of the Sgr A Complex (colour image – red: nonthermal Sgr A East, yellow: thermal Sgr A West and the four compact H ii regions of which A is the northernmost, close to our observational position) (Serabyn et al. 1992). The FWHM Herschel 487 and 774 GHz beams, H (northernmost) and V polarizations, for the HOP observations we have carried out are indicated by red and yellow circles, respectively. |
The line of sight from the Sun to Sgr A crosses a number of Galactic spiral arms and thus can serve to probe the properties of the Local Arm-Feature A (+5 km s-1), the Sagittarius Arm (−2 km s-1), the giant Scutum Arm (−7 km s-1), the −30 km s-1 Arm (−30 km s-1), the 3 kpc Arm (−52 km s-1), and the expanding molecular ring (EMR) (−130 km s-1), with the approximate radial velocities with respect to the local standard of rest (LSR) given in parenthesis (e.g. Sandqvist 1970). This configuration is sketched in Fig. 2. The physical conditions in the spiral arms are radically different from those in the Galactic centre region. The arms contain a diffuse cold neutral medium with densities of the order of 50−100 cm-3 and a kinetic temperature of about 100 K, in approximate pressure equilibrium with a warm neutral medium with densities of about 0.4 cm-3 and a temperature of about 8000 K (Gerin et al. 2015). The arms also contain cold dense matter, often in the form of dark clouds, with densities of the order of 103−104 cm-3 and a kinetic temperature of about 10 K. Absorption lines from regions seen towards background continuum sources serve as convenient probes of the properties of the cold neutral medium in the spiral arms, (e.g. Karlsson et al. 2013).
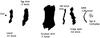 |
Fig. 2 Line of sight from the Sun to the Sgr A Complex at the Galactic centre cuts through a number of spiral arm features, shown in this sketch, which also indicates their approximate radial velocities with respect to the LSR. Assuming that the distance from the Sun to the Galactic centre is 8 kpc, the estimated distances from the Sun to the spiral arm features are as follows: Local – |


The search for molecular oxygen (O2) in the interstellar medium was a major objective for the Submillimeter Wave Astronomy Satellite (SWAS; Melnick et al. 2000) and the Odin satellite (Nordh et al. 2003). The surprising results were that the abundance of molecular oxygen was more than 100 times lower than expected from gas-phase chemistry predictions, and only in one source, namely ρ Oph A, was O2 actually detected (Larsson et al. 2007). Odin also led to an O2 abundance upper limit of ≲ 1.2 × 10⁻⁷ for the whole Sgr A molecular belt region and the results of a first simple modeling are presented by Sandqvist et al. (2008) and Hollenbach et al. (2009). (The Odin 119-GHz O2 9 arcmin beam included both the +20 and +50 km s-1 Clouds and the ridge in between).
The Herschel open time key program, Herschel Oxygen Project (HOP), (co-principal investigators: P. Goldsmith and R. Liseau) was designed to investigate the problem of the unexpectedly low O2 abundance and we have observed a number of sources with Herschel. The first results, reporting the detection of O2 in Orion, were published by Goldsmith et al. (2011), who also give a thorough review of the question of the abundance of O2. The second HOP results, confirming the Odin detection of O2 in ρ Oph A, were presented by Liseau et al. (2012). Observations towards the Orion Bar photo-dissociation region (PDR) and the low-mass protostar NGC 1333 IRAS 4A did not reveal the presence of any O2 (Melnick et al. 2012; Yildiz et al. 2013). Recently, Chen et al. (2014) developed a shock model to explain the O2 observations of the Orion H2 Peak 1 and Hot Core. One of the additional objects observed by HOP is the Sgr A +50 km s-1 Cloud, the topic of the present paper. In addition to improving the understanding of the Sgr A Complex, we chose Sgr A rather than Sgr B2 – the more standard molecular search candidate – partly because of the greater variety of physical phenomena in the Sgr A Complex, which possibly increases the chances of success in searching for this elusive molecule. In addition, the expected lower line density towards Sgr A should facilitate more secure identification of the molecular line carriers.
2. Observations
The Herschel O2 search in the Sgr A Complex was focused on the +50 km s-1 Cloud. The chosen position, J2000.0  (+152′′,+75′′ – equatorial offsets from Sgr A∗), corresponds to the position used in the Odin H2O/O2 observations (see Table 1 and Fig. 1 of Sandqvist et al. 2008) and is indicated with the Herschel beams in Fig. 1. This position lies in the region not yet reached by the shock caused by Sgr A East. Thus it is reasonable that the gas there has a lower temperature, which is also implied by the lack of significant NH3(3,3) emission (McGary et al. 2001). This position is also very close to the northernmost of the four compact H ii regions (A) – see Fig. 1.
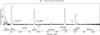 |
Fig. 3 487 GHz spectrum observed towards the Sgr A +50 km s-1 Cloud, with a linear baseline subtracted. The velocity resolution is 0.9 km s-1. The frequency scale is calibrated for a radial velocity of 45.2 km s-1 for easier identification of the emission lines. (This results in a shift of the frequencies of the absorption lines, which do not originate in the +50 km s-1 Cloud, see text.) |
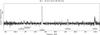 |
Fig. 4 498 GHz spectrum observed towards the Sgr A +50 km s-1 Cloud, with a linear baseline subtracted. The velocity resolution is 0.9 km s-1. The frequency scale is calibrated for a radial velocity of 45.2 km s-1 for easier identification of the emission lines. |
The 487 and 774 GHz observations were performed on OD 503 (2010 September 29) and OD 491 (2010 September 16, 17), respectively. The double beam-switch mode (DBS) was used yielding two OFF-beam positions located 3′ on either side of the source along a position angle (PA) of 92°. The OFF-positions thus fall outside the main molecular emission region. To ensure the reality of features without confusion from conflicting upper and lower sideband effects, a sequence of eight local oscillator (LO) settings was used with separations from 120 to 250 MHz and from 30 to 270 MHz for the 487 and 774 GHz observations, respectively. This resulted in a total ON-source integration time of 2.9 h for each of the two frequencies. After combining the H- and V-polarisation channels, the final value of the ON-source integration time is 5.8 h. The Wide Band Spectrometer (WBS) has a channel resolution of 1.10 MHz, or 0.68 and 0.43 km s-1 at 487 and 774 GHz, respectively. The standard Herschel pipeline, HIPE1 (Ott 2010) version 11, has been employed for calibration and initial reductions.
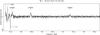 |
Fig. 5 774 GHz spectrum observed towards the Sgr A +50 km s-1 Cloud, with a linear baseline subtracted. The velocity resolution is 1.0 km s-1. The frequency scale is calibrated for a radial velocity of 45.2 km s-1 for easier identification of the emission lines. (This results in a shift of the frequency of the U1 absorption line, which does not originate in the +50 km s-1 cloud, see text.) |
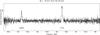 |
Fig. 6 785 GHz spectrum observed towards the Sgr A +50 km s-1 Cloud, with a linear baseline subtracted. The velocity resolution is 1.0 km s-1. The frequency scale is calibrated for a radial velocity of 45.2 km s-1 for easier identification of the emission lines. |
Throughout the paper the intensities are given in terms of the antenna temperature, TA, unless otherwise stated. The main beam efficiencies for the Herschel telescope are 0.62 in the 487, 498 and 0.63 in the 774, 785 GHz frequency bands, respectively, while the half-power beamwidths are 43′′ and 27′′ (Mueller et al. 2014; Roelfsema et al. 2012).
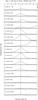 |
Fig. 7 All the CH3OH emission lines in the four spectral bands and the C17O (7−6) emission line towards the Sgr A +50 km s-1 Cloud. |
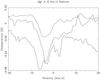 |
Fig. 8 Upper profile: Herschel H |

3. Results
We present here our HIFI observations towards the +50 km s-1 Cloud in Sgr A. The 487 and 498 GHz spectra are shown in Figs. 3 and 4, respectively, and the 774 and 785 GHz spectra in Figs. 5 and 6. They are dominated by a number of CH3OH lines, which we show in more detail in Fig. 7, together with the higher frequency CH3OH lines. The two double absorption features seen in Fig. 3, which we have now identified as originating from H Cl+ and H
 Cl+, have previously been presented by Neufeld et al. (2012). There are many other emission lines and an additional absorption line which we have identified in our four spectra. The absorption line, U1, seen in the 774 GHz band, has a shape remarkably similar to the 0 km s-1 feature of the H2Cl+ line, see Fig. 8. Assuming that the U1-line arises from the same region as the H2Cl+ line, we determine a frequency to be 771.365 GHz, which is the rest frequency of the 54,1−63,4 transition of the deuterated formaldehyde molecule, HDCO. For comparison, we also display in Fig. 8 the relevant part of the 6 cm formaldehyde (H2CO) absorption profile obtained towards Sgr A with the National Radio Astronomy Observatory (NRAO) 140-foot radio telescope (Sandqvist 1970). However, the high lower state energy value of 137 K, together with the fact that neither the corresponding high energy absorption line from H2CO itself nor that of H
 CO have been detected toward the Sgr A +50 km s-1 Cloud, make the identification of such an absorption line from HDCO very tentative.
A summary of the emission lines and Gaussian fits is presented in Table 1, where V, TA and ΔV are the fitted radial velocity with respect to the LSR, antenna temperature, and full width at half measure (FWHM) line width, respectively. Also, the integrated line intensity, ∫TAdV, is listed. In a few cases, the lines are blended and the integrated intensity is therefore determined from the Gaussian parameters. The Einstein coefficient Aul and energy of the upper level Eu for most of the transitions are also listed. Since methanol is a slightly asymmetric rotor, the two A- and E- symmetric states have been identified. A summary of the absorption lines is presented in Table 2. The line identifications rely upon the Splatalogue2, the Cologne Database for Molecular Spectroscopy (CDMS3; Müller et al. 2005), and the Jet Propulsion Laboratory (JPL4; Pickett et al. 1998) molecular spectroscopy data bases available online.
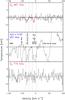 |
Fig. 9 487 and 774 GHz O2 spectra towards the Sgr A +50 km s-1 Cloud, compared with a 557 GHz o-H2O profile observed 44′′ west and 20′′ south of our position. The scale of the H2O profile has been multiplied by 0.05. The channel resolution of both O2 spectra is 0.9 km s-1. |
We see no significant signs of any spectral emission features at the O2 frequencies of 487.249 and 773.840 GHz in Figs. 3 and 5, respectively. We present these two spectra near the O2 frequencies in greater detail in Fig. 9. To clarify some of the expected spectral features, often seen in molecular lines towards the Sgr A +50 km s-1 Cloud, we have also plotted a relevant part of a 557 GHz o-H2O profile, observed with Herschel towards a position which is 44′′ west and 20′′ south of ours. Other comparisons with OH, H2O, NH3, and C18O are possible, see e.g. Karlsson et al. (2013).
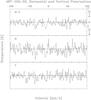 |
Fig. 10 487 GHz O2 spectra towards the Sgr A +50 km s-1 Cloud. Horizontal (middle H) and Vertical (lower V) polarisations. The average (upper H+V) of these two profiles is also shown. |
For the +50 km s-1 Cloud, we obtain mean values of the radial velocity and FWHM line width of 28 emission lines presented in Table 1 as Vmean = + 45.2 km s-1 and ΔVmean = 17.1 km s-1. To obtain an upper limit for the expected O2 emission line strengths, we smooth the spectra to a velocity resolution of 17.1 km s-1 and determine the root mean square (rms) value of the resulting spectra. These values are 0.22 and 0.42 mK for the 487 and 774 GHz lines, respectively. Correcting for the beam efficiencies of 0.62 and 0.63 (Mueller et al. 2014) and obtaining 3σ values we get Tmb,3σ ≤ 1.06 mK for the 487 GHz and ≤ 2.0 mK for the 774 GHz O2 lines.
4. Discussion
4.1. The +50 km s-1 Cloud
We derive an estimate of the upper limit to the abundance of O2 in the +50 km s-1 Cloud, using the online version of RADEX5 (van der Tak et al. 2007). Assuming a gas temperature of T = 80 K and a gas density of nH2 = 104 cm-3 (Walmsley et al. 1986; Sandqvist et al. 2008) and a line width of 17.1 km s-1 (see Sect. 3), we apply RADEX to our two upper limits of Tmb,3σ for the 487 and 774 GHz O2 lines. The resulting upper limit for the O2 column density is N(O2) ≤ 1.4 × 1016 cm-2. With a column density of H2 towards the +50 km s-1 Cloud N(H2) = 2.4 × 1023 cm-2 (Lis & Carlstrom 1994), we finally obtain a 3σ upper limit for the O2 abundance with respect to H2 of X(O2) ≤ 5 × 10⁻⁸. These column density and abundance limits are lower than the Odin limits for this source and also somewhat lower than the level predicted by the extended PDR model of Hollenbach et al. (2009), as discussed by Sandqvist et al. (2008). The abundance limit is also lower than Odin limits obtained for a dozen Galactic sources of different types (Pagani et al. 2003).
Summary of observed emission lines and Gaussian fits.
Summary of observed absorption lines and Gaussian fits.
4.2. O2 absorption lines?
The 487 GHz profile in Fig. 9 indeed shows no sign of any O2 emission, but what about absorption? The two weak features near velocities of −5 and −30 km s-1 could at first sight be rejected as relatively large noise wiggles. The uncomfortable fact, however, is that these wiggles seem to occur close to velocities which have strong corresponding H2O absorption, as can be seen in this figure. The many absorption lines in the H2O profile originate in the different spiral arm features which the line of sight crosses between the Sun and the Galactic centre; there is also broad H2O emission and self-absorption at positive velocities originating in the +50 km s-1 Cloud itself. If the two weak features in the upper (487 GHz O2) profile were due to an unknown molecule with a rest frequency near that of O2, a different aligment with two other H2O absorption lines would not agree for both lines due to the unique velocity separation of this pair. A comparison of the horizontal (H) and vertical (V) polarisation profiles may offer a little support for the reality of these two weak features although the result is just at the margin of detectability, as shown in Fig. 10. The feature near −5 km s-1 can be seen in both the H and V polarisations. The feature near −30 km s-1, although clear in the H profile, may be masked by noise in the V profile and is certainly smaller than a spurious wiggle at a more negative velocity, which, however, is completely absent in the H profile. A careful study of the OFF-spectra reveals a weak ripple-structure, which, however, changes character at the positions of these two features. No obvious emission could be identified in the OFF-spectra. Gaussian fits to the two absorption features in Fig. 9 are presented in Table 2.
In the following analysis, we shall hypothesize that these two components are caused by the presence of O2 in the spiral arms, absorbing the continuum radiation from the dust emission in the +50 km s-1 Cloud at the Galactic centre. Since the Herschel reference beams are offset from the main beam by 3′ along a PA of 92°, they observe regions outside the continnum emission from the +50 km s-1 Cloud (see Lis & Carlstrom 1994). The angular widths of the spiral arms are much greater than this and we shall here assume that the spiral arm gas is uniform in terms of the excitation temperature and the optical depth across the ON- and OFF-beams. The temperature in the OFF-beams, TOFF, will thus be given by 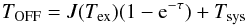 (1)where J(Tex) = hν/k × [ ehν/kTex−1 ] -1, Tex is the excitation temperature, τ is the optical depth, and Tsys is the system noise temperature. The temperature in the ON-beam, TON, is given by
  (2)where Tc is the temperature of the continuum background.
The resulting double beam switched line intensity is then  (3)which allows us to determine the optical depth, τ.
From our observations, we obtain a continuum antenna temperature of 119 mK at 487 GHz and using our absorption line values from Table 2, we then get optical depths of 0.029 and 0.021 for the −7.1 and −32.6 km s-1 features, respectively. If we apply RADEX to the conditions in the cold neutral medium with a temperature of 100 K and a density of 100 cm-3, the previously determined optical depths result in column densites of 1.3 × 1018 cm-2 in the −7.1 km s-1 feature and 1.5 × 1018 cm-2 in the −32.6 km s-1 feature.
No absorption lines are seen in the 774 GHz profile in Fig. 9. The continuum antenna temperature at this frequency is 288 mK and the rms noise level is 2.0 mK. Smoothing the profile to channel resolutions of 4.7 and 7.5 km s-1 (which correspond to the line widths of the −7.1 and −32.6 km s-1 487 GHz O2 absorption features, respectively) yield 3σ upper limits of −2.7 and −2.1 mK for the TA of possible absorptions. We thus have a lower limit of about 1.2 for the ratio of intensities of the 487/774 GHz lines, which implies that the kinetic temperature of the −7.1 and −32.6 km s-1 features must be less than 60 K (RADEX, assuming a density of 1000 cm-3, see below). This temperature may be even lower, since we may here be dealing with absorption lines rather than emission lines and the energy of the lower level of the 774 GHz O2 line is 16.4 K. The variation of the excitation temperature of the 487 GHz O2 line as a function of density for three different kinetic temperatures is shown in Fig. A.1 in the Appendix. (We note that excitation of the O2 molecule can occur by collisions with H i and electrons as well as with H2 molecules (Gerin et al. 2015; Lique et al. 2014).)
It is possible to limit the expected range of volume density of the regions in question by using Sweden ESO Submillimeter Telescope (SEST) observations of C18O (J = 1−0) (Lindqvist et al. 1995) and C18O (J = 2−1) (Karlsson et al. 2013) at our position in the +50 km s-1 Cloud. We have smoothed the (2−1) observations to the same angular resolution as the (1−0) observations, namely 45′′, which is similar to that of our Herschel observations. The ratio of the two resulting profiles for the −7.1 and −32.1 features is ≈ 1. According to RADEX modelling, this ratio requires molecular hydrogen densities of about 800 or 1800 cm-3 for temperatures of 100 or 30 K, respectively. We therefore conclude that the hydrogen density in these regions is closer to 1000 cm-3 rather than an order of magnitude lower.
If we now again apply RADEX to the above absorption O2 optical depths using a temperature of 30 K and density of 1000 cm-3 we get column densites of 7.9 × 1017 cm-2 and 9.0 × 1017 cm-2 for the two features. The H2 column densities of these two features towards the +50 km s-1 Cloud are 5.5 × 10²¹ and 3.2 × 1021 cm-2 (Sandqvist et al. 2003). Thus we arrive at O2 abundances with respect to H2 of X(O2) = 1.4 × 10⁻⁴ and 2.8 × 10⁻⁴ in the −7.1 and −32.6 km s-1 features, respectively, implying that practically all available oxygen is in the form of O2. However, we note that the estimated strikingly high abundance of O2 partly is a result of the low H2 column densities of the spiral arm clouds (corresponding to only 3−6 mag of visual extinction). We estimate an uncertainty in the H2 values of 40%, of which 30% is due to the uncertainty in the CO-H2 conversion factor in the Milky Way disk (Bolatto et al. 2013).
The corresponding main beam brightness temperature of the 487 GHz O2 emission from the uniform, extended spiral arm cloud assumed in the current analysis, as predicted by RADEX, is 0.2 K. However, the 5σ intensity limit reached in our earlier Odin observations at 487 GHz, using position-switching to a distant, emission-free region is as low as 0.02 K in the  antenna beam (Sandqvist et al. 2008). This leads us to conclude that our previous assumption of an exactly uniform cloud covering the Herschel ON and OFF beams must be incorrect. It is unlikely that the O2 absorption comes from the cold neutral medium, but rather from more compact molecular clouds.
One way to avoid the above contradiction (perhaps unlikely) would be to assume that the Herschel lines are caused by localized absorption in front of the continuum source, i.e. the regions giving rise to these lines are small with respect to the Odin beam. This would result in an Odin non-detection due to beam dilution effects and the absorbing clouds would have to be smaller than 68″−46″.
4.3. O2 upper limits implied by Odin observations
Based on the assumption that there are no beam dilution effects, the two weak O2 absorption lines observed by Herschel, if at all real, may instead be caused by a weak excess emission in the OFF beam average, as compared to that in the ON position, although we have not been able to confirm this from our study of the OFF-spectra. If we apply RADEX, with the same cloud parameters as above (30 K and 1000 cm-3), to the 5σ upper limit of 0.02 K observed by Odin in the ON position, the O2 column density upper limits in the −7.1 and −32.6 km s-1 features instead become ≤ 4.9 × 1016 cm-2 and ≤ 7.8 × 1016 cm-2, respectively. Thus we arrive at upper limits to the O2 abundances in these two features of ≤ 9 × 10⁻⁶ and ≤ 2 × 10⁻⁵.
4.4. Herschel differential OFF-ON O2 emission
If we now assume that the observed Herschel absorption lines are apparent only and due to a differential emission between the OFF and ON beams we may obtain indications of O2 abundance limits depending upon the specific conditions. We consider it unlikely that there will be emission in both OFF beams and none in the ON beam, so the simplest condition is no emission in the ON beam and emission in one OFF beam. In this case we apply RADEX to the same conditions as before, i.e. for a temperature of 30 K and a density of 1000 cm-3. Correcting for a beam efficiency of 0.62, we get main beam brightness temperatures of +5.5 and +4.0 mK for the −7.1 and −32.6 km s-1 “emission” features, respectively. But since we assume emission in only one OFF beam, the effective main beam brightness temperatures will be twice as high, i.e. +11.0 and +8.0 K. The best RADEX fits then give O2 column densities of 2.7 × 10¹⁶ and 3.1 × 1016 cm-2, which correspond to O2 fractional abundances of 4.9 × 10⁻⁶ and 10 × 10-6, respectively for the two features. These two O2 abundances can be considered as Herschel upper limits and are less than the previous Odin values, see Table 3. A more complicated condition would be if there is emission also in the ON beam, then the OFF emission must be stronger to compensate for the ON emission, and thus the above limits would really be lower limits.
Column densities and abundances for O2. (Tk = 30 K, nH = 1000 cm-3).
A summary of the O2 abundance values is presented in Table 3, where we have also tabulated the corresponding abundances of OH, H2O, and NH3 resulting from Very Large Array (VLA), SEST, and Odin observations (Karlsson et al. 2013).
4.5. O2 and Galactic spiral arm shocks
The highest O2 abundances modelled so far to fit observations were developed to explain the observations of O2 in a unique highly compact region in Orion, where a value of close to 10-4 could be obtained by means of shock chemistry (Chen et al. 2014). The velocity of the feature near 0 km s-1 is −7.1 km s-1, which probably means that it originates in the giant Scutum spiral arm (Sandqvist 1970). The H2CO profile in that paper, which is also reproduced in Fig. 8, has an exceptionally deep absorption close to this velocity. The other feature has a velocity of −32.6 km s-1 and thus probably originates in the −30 km s-1 Arm. The Scutum Arm is one of the two major spiral arms in the Galaxy and in the direction of the Galactic centre lies at a distance of ≈3 kpc from the Sun (Reid et al. 2009). The −30 km s-1 Arm is even closer to the central region of the Galaxy, but still outside the 3 kpc Arm (e.g. Corbel & Eikenberry 2004). We note in Table 2 that the velocities of the H2Cl+ features differ from the O2. The H2Cl+ feature near −51 km s-1 originates in the 3 kpc Arm, that near −3 km s-1 in the Sgr Arm and that near +4 km s-1 in the Local Arm. Also, the U1(HDCO?) line is detected only in the Local and Sgr arms, possibly due to blending effects. On the other hand, H2CO is apparently present in all of the Local, Sgr, Scutum, −30 km s-1, and 3 kpc Arms (Fig. 8 and Sandqvist 1970).
What makes the Scutum Arm and the −30 km s-1 Arm possibly conducive to a high abundance of O2 is at the present time a mystery if the two absorption features are indeed due to O2. However, none of the other spiral features along the line of sight to the Galactic centre is even comparable in magnitude to the Scutum Arm. A study of the shock chemistry caused by the action of the Galactic density wave (e.g. Shu et al. 1973; Roberts & Stewart 1987; Sundelius et al. 1987; Martos & Cox 1998; Gomez & Cox 2004a,b) in the major Scutum spiral arm might provide some answers to our dilemma. The existence of spiral density wave shocks in the Milky Way Galaxy is very likely but has not been fully observationally proven because of our location inside the Galaxy. However, the existence can safely be inferred, based upon the convincing observational proof in some nearby spiral galaxies. In the grand design Sc spiral galaxy M 51, both the radial and tangential velocity components, as observed in CO, show steep gradients across the spiral arms in accordance with the predictions of density wave theory and numerical modelling experiments (e.g. Rydbeck et al. 1985; Adler et al. 1992; Aalto et al. 1999; Schinnerer et al. 2010). Similar convincing results have been published in case of the SAB galaxy M83 (Lundgren et al. 2004a,b). In addition, strong shocks have been predicted and observed along the leading edges of galactic bars, e.g. NGC 1365 (Lindblad et al. 1996). This galaxy presents strong absorbing lanes and strong velocity shocks along the leading side of the bar, but also a number of dark lanes across the bar ending at the shocks.
If we assume that shocks are responsible for the O2 tentatively detected in absorption at −7.1 km s-1 and at −32.6 km s-1, then using the models presented in Chen et al. (2014) we find that we are only able to produce enough O2 by assuming a pre-shock density of 1000 cm-3 and a shock velocity of at least 20 km s-1. These may not be unreasonable values for the Milky Way Galaxy. In M 51, a galaxy with a strong spiral density wave, the value of arm-to-interarm CO intensity ratio of ≈ 6, found by Aalto et al. (1999), implies the existence of some moderately high density interarm gas which enters the density wave shock and spiral arm region with a velocity of ≈ 50 km s-1. Of course, as reported in Chen et al. (2014), several assumptions are made when running a 1D shock chemical model, including the geometry of the shocked regions. However, our tentative detection cannot be substantiated by any further modelling at this stage and until further observations confirm the presence of O2.
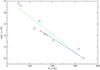 |
Fig. 11 Population diagram for CH3OH-A (squares) and CH3OH-E (circles). Eu is the energy of the upper level, Cl a constant of the line and W is the integrated main beam line intensity. |
4.6. Possible alternative interpretation of the absorption features
It should also be mentioned that a frequency coincidence of these two absorption features (if near 0 and −30 km s-1) exists with the cis-HOCO (42,2−31,3) line at 487.256 GHz. The energy of the lower state is only 12.7 K. cis-HOCO is a higher energy conformer (800 K higher than trans-HOCO) of a not yet detected interstellar molecule. However, even a tentative identification of cis-HOCO is ruled out by the fact that the line in question is only one out of ten cis-HOCO (42,2−31,3) hyperfine transitions, where the transitions at 487.535, 487.536, 488.195 and 488.201 GHz are expected to be more than an order of magnitude stronger than the one at 487.256 GHz. These other hyperfine transitions are not visible in our observed spectrum (the Einstein A coefficients of the four lines are 30 times larger than that of the identification candidate).
4.7. Methanol properties of the +50 km s-1 Cloud
We have made a simple population diagram analysis (Goldsmith & Langer 1999) of unblended CH3OH-A and CH3OH-E lines in Table 1 (the 13CH3OH lines gave inconclusive results, possibly due to sensitivity effects and blends). The diagram is shown in Fig. 11. The slopes of the fitted straight lines gave rotation temperatures of Trot ≈ 64 and 79 K for CH3OH-A and CH3OH-E, respectively, at the observed position of the +50 km s-1 Cloud. This range is close to the kinetic temperature of 80 K which we have adopted for this cloud. A further RADEX analysis of the CH3OH-A lines, using the same input values as for the above O2 RADEX analysis, yielded a best fit column density of N(CH3OH) ≈ 1.3 × 1017 cm-2, and thus an abundance with respect to H2 of X(CH3OH) ≈ 5 × 10⁻⁷. This value is slightly greater than the upper value in the range of 10-7−10-9 found generally in the inner 30 pc of the Galactic centre (e.g. Yusef-Zadeh et al. 2013). But it is consistent with the higher production rate of CH3OH expected from the proximity and interaction of the +50 km s-1 Cloud with the high-energy expanding non-thermal shell of Sgr A East.
5. Conclusions
We have searched for O2 in the Sgr A +50 km s-1 molecular cloud in the Galactic centre, using the HIFI system aboard the Herschel Space Observatory. We obtain a 3σ upper limit for the O2 abundance relative to H2 of X(O2) ≤ 5 × 10⁻⁸ in that cloud. From an analysis of the CH3OH-A and CH3OH-E emission lines we obtain a rotation temperature range of approximately 64 to 79 K and a CH3OH abundance of 5 × 10⁻⁷.
If two Herschel weak apparent absorption lines in the 487 GHz spectrum are due to O2, we estimate the O2 abundance with respect to H2 in two inner Galactic spiral arms (the Scutum Arm and the −30 km s-1 Arm) to be
-
(i)
(1.4−2.8) × 10-4, assuming absorption by foreground clouds,
-
(ii)
≤ (1−2) × 10-5, assuming weak excess emission in the Herschel OFF-beam average and using Odin non-detection limits,
-
(iii)
≈ (5−10) × 10-6, assuming that the apparent absorption lines are due to a differential emission between the Herschel OFF and ON beams and using Herschel intensities.
A simple model study suggests that shocks caused by a Galactic spiral density wave may produce O2 in a 30 K and 1000 cm-3 medium located in the giant Scutum spiral Arm.
Acknowledgments
We wish to thank Per Olof Lindblad for useful discussions and comments concerning Galactic density waves and resulting shock interaction with Galactic spiral arms. We are very grateful to our anonymous referee whose thorough report significantly improved this paper. We also wish to thank the Swedish National Space Board (SNSB) for its continued financial support. Furthermore we express our appreciation to the individuals making, updating and maintaining the Splatalogue, CDMS and JPL molecular spectroscopy data bases for their unselfish demanding work. HIFI has been designed and built by a consortium of institutes and university departments from across Europe, Canada and the US under the leadership of SRON Netherlands Institute for Space Research, Groningen, The Netherlands with major contributions from Germany, France and the US. Consortium members are: Canada: CSA, U. Waterloo; France: CESR, LAB, LERMA, IRAM; Germany: KOSMA, MPIfR, MPS; Ireland, NUI Maynooth; It aly: ASI, IFSI-INAF, Arcetri-INAF; Netherlands: SRON, TUD; Poland: CAMK, CBK; Spain: Observatorio Astronomico Nacional (IGN), Centro de Astrobiologia (CSIC-INTA); Sweden: Chalmers University of Technology MC2, RSS and GARD, Onsala Space Observatory, Swedish National Space Board, Stockholm University Stockholm Observatory; Switzerland: ETH Zürich, FHNW; USA: Caltech, JPL, NHSC. Support for this work was provided by NASA through an award issued by JPL/Caltech.
References
- Aalto, S., Hüttemeister, S., Scoville, N. Z., & Thaddeus, P. 1999, ApJ, 522, 165 [NASA ADS] [CrossRef] [Google Scholar]
- Adler, D. S., Lo, K. Y., Wright, M. C. H., et al. 1992, ApJ, 392, 497 [NASA ADS] [CrossRef] [Google Scholar]
- Bolatto, A. D., Wolfire, M., & Leroy, A. K. 2013, ARA&A, 51, 207 [Google Scholar]
- Chen, J.-H., Goldsmith, P. F., Viti, S., et al. 2014, ApJ, 793, 111 [NASA ADS] [CrossRef] [Google Scholar]
- Corbel, S., & Eikenberry, S. S. 2004, A&A, 419, 191 [NASA ADS] [CrossRef] [EDP Sciences] [Google Scholar]
- Ekers, R. D., van Gorkom, J. H., Schwarz, U. J., & Goss, W. M. 1983, A&A, 122, 143 [NASA ADS] [Google Scholar]
- Ferrière, K. 2012, A&A, 540, A50 [NASA ADS] [CrossRef] [EDP Sciences] [Google Scholar]
- Gerin, M., Ruaud, M., Goicoechea, J. R., et al. 2015, A&A, 573, A30 [NASA ADS] [CrossRef] [EDP Sciences] [Google Scholar]
- Goldsmith, P. F., & Langer, W. F. 1999, ApJ, 517, 209 [NASA ADS] [CrossRef] [Google Scholar]
- Goldsmith, P. F., Liseau, R., Bell, T. A., et al. 2011, ApJ, 737, 96 [Google Scholar]
- Gomez, G. C., & Cox, D. P. 2004a, ApJ, 615, 744 [NASA ADS] [CrossRef] [Google Scholar]
- Gomez, G. C., & Cox, D. P. 2004b, ApJ, 615, 758 [NASA ADS] [CrossRef] [Google Scholar]
- Hollenbach, D., Kaufman, M. J., Bergin, E. A., & Melnick, G. J. 2009, ApJ, 690, 1497 [CrossRef] [Google Scholar]
- Karlsson, R., Sandqvist, Aa., Hjalmarson, Å., et al. 2013, A&A, 554, A141 [NASA ADS] [CrossRef] [EDP Sciences] [Google Scholar]
- Larsson, B., Liseau, R., Pagani, L., et al. 2007, A&A, 466, 999 [Google Scholar]
- Lindblad, P. A. B., Lindblad, P. O., & Athanassoula, E. 1996, A&A, 313, 65 [NASA ADS] [Google Scholar]
- Lindqvist, M., Sandqvist, Aa., Winnberg, A., Johansson, L. E. B., & Nyman, L.-Å. 1995, A&AS, 113, 257 [NASA ADS] [Google Scholar]
- Lique, F., Kalugina, Y., Chefdeville, S., et al. 2014, A&A, 567, A22 [NASA ADS] [CrossRef] [EDP Sciences] [Google Scholar]
- Lis, D. C., & Carlstrom, J. E. 1994, ApJ, 511, 235 [Google Scholar]
- Liseau, R., Goldsmith, P. F., Larsson, B., et al. 2012, A&A, 541, A73 [NASA ADS] [CrossRef] [EDP Sciences] [Google Scholar]
- Lundgren, A. A., Wiklind, T., Olofsson, H., & Rydbeck, G. 2004a, A&A, 413, 505 [NASA ADS] [CrossRef] [EDP Sciences] [Google Scholar]
- Lundgren, A. A., Olofsson, H., Wiklind, T., & Rydbeck, G. 2004b, A&A, 422, 865 [NASA ADS] [CrossRef] [EDP Sciences] [Google Scholar]
- Martos, M. A., & Cox, D. P. 1998, ApJ, 509, 703 [NASA ADS] [CrossRef] [Google Scholar]
- McGary, R. S., Coil, A. L., & Ho, P. T. P. 2001, ApJ, 559, 326 [NASA ADS] [CrossRef] [Google Scholar]
- Melnick, G. J., Stauffer, J. R., Ashby, M. L. N., et al. 2000, ApJ, 539, L77 [NASA ADS] [CrossRef] [Google Scholar]
- Melnick, G. J., Tolls, V., Goldsmith, P., et al. 2012, ApJ, 752, 26 [NASA ADS] [CrossRef] [Google Scholar]
- Mezger, P. G., Duschl, W. J., & Zylka, R. 1996, A&AR, 7, 289 [Google Scholar]
- Morris, M., & Serabyn, E. 1996, ARA&A, 34, 645 [NASA ADS] [CrossRef] [Google Scholar]
- Müller, H. S. P., Schlöder, F., Stutzki, J., & Winnewisser, G. 2005, J. Mol. Struct., 742, 215 [NASA ADS] [CrossRef] [Google Scholar]
- Mueller, M., Jellema, W., Olberg, M., Moreno, R., & Teyssier, D. 2014, Herschel Release Note for Astronomers, HIFI-ICC-RP-2014-001 [Google Scholar]
- Neufeld, D. A., Roueff, E., Snell, R. L., et al. 2012, ApJ, 748, 37 [NASA ADS] [CrossRef] [Google Scholar]
- Nordh, H. L., von Schéele, F., Frisk, U., et al. 2003, A&A, 402, L21 [NASA ADS] [CrossRef] [EDP Sciences] [Google Scholar]
- Ott, S. 2010, in Astronomical Data Analysis Software and Systems XIX, eds. Y. Mizumoto, K.-I. Morita, & M. Ohishi (San Francisco, CA: ASP), ASP Conf. Ser., 434, 139 [Google Scholar]
- Pagani, L., Olofsson, A. O. H., Bergman, P., et al. 2003, A&A, 402, L77 [NASA ADS] [CrossRef] [EDP Sciences] [Google Scholar]
- Pickett, H. M., Poynter, R. L., Cohen, E. A. et al. 1998, J. Quant. Spectrosc., & Rad. Transfer, 60, 883 [Google Scholar]
- Reid, M. J., Menten, K. M., Zheng, X. W., et al. 2009, ApJ, 700, 137 [NASA ADS] [CrossRef] [Google Scholar]
- Roberts, W. W., & Stewart, G. R. 1987, ApJ, 314, 10 [NASA ADS] [CrossRef] [Google Scholar]
- Roelfsema, P. R., Helmich, F. P., Teyssier, D., et al. 2012, A&A, 537, A17 [NASA ADS] [CrossRef] [EDP Sciences] [Google Scholar]
- Rydbeck, G., Hjalmarson, Å., & Rydbeck, O. E. H. 1985, A&A, 144, 282 [NASA ADS] [Google Scholar]
- Sandqvist, Aa. 1970, AJ, 75, 135 [NASA ADS] [CrossRef] [Google Scholar]
- Sandqvist, Aa., Bergman, P., Black, J. H., et al. 2003, A&A, 402, L63 [NASA ADS] [CrossRef] [EDP Sciences] [Google Scholar]
- Sandqvist, Aa., Larsson, B., Hjalmarson, Å., et al. 2008, A&A, 482, 849 [NASA ADS] [CrossRef] [EDP Sciences] [Google Scholar]
- Schinnerer, E., Weiss, A., Aalto, S., & Scoville, N. Z. 2010, ApJ, 719, 1588 [NASA ADS] [CrossRef] [Google Scholar]
- Serabyn, E., Lacy, J. H., & Achtermann, J. M. 1992, ApJ, 395, 166 [NASA ADS] [CrossRef] [Google Scholar]
- Shu, F. H., Milione, V., & Roberts, W. W. 1973, ApJ, 183, 819 [NASA ADS] [CrossRef] [Google Scholar]
- Sundelius, B., Thomasson, M., Valtonen, M. J., & Byrd, G. G. 1987, A&A, 174, 67 [NASA ADS] [Google Scholar]
- van der Tak, F. F. S., Black, J. H., Schöier, F. L., Jansen, D. J., & van Dishoeck, E. F. 2007, A&A, 468, 627 [NASA ADS] [CrossRef] [EDP Sciences] [Google Scholar]
- Walmsley, C. M., Güsten, R., Angerhofer, P., & Mundy, L. 1986, A&A, 155, 129 [NASA ADS] [Google Scholar]
- Yildiz, U., Acharyya, K., Goldsmith, P., et al. 2013, A&A, 558, A58 [NASA ADS] [CrossRef] [EDP Sciences] [Google Scholar]
- Yusef-Zadeh, F., Cotton, W., Viti, S., Wardle, M., & Royster, M. 2013, ApJ, 764, L19 [NASA ADS] [CrossRef] [Google Scholar]
Appendix A: Excitation temperature of the 487 GHz O2 line
The detection of O2 in absorption would be in itself surprising. To see an absorption line, the excitation temperature must be lower than the background contiuum temperature. But the O2 lines have low critical densities and are easily excited even in low density foreground clouds. We have performed a RADEX analysis to illustrate the variation of excitation temperature of the 487 GHz O2 line as a function of molecular hydrogen cloud density at three kinetic temperatures, viz. 30, 60 and 100 K. The results are shown in Fig. A.1.
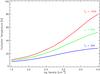 |
Fig. A.1 Excitation temperature vs. cloud density for the 487 GHz O2 transition resulting from RADEX multi-transition analysis, using three values of kinetic temperature: 30, 60 and 100 K. |
All Tables
All Figures
|
Fig. 1 Sgr A +50 km s-1 Cloud, delineated by the integrated emission (+20 to +80 km s-1) in the CS(5−4) line (contours), superimposed upon a 6 cm continuum map of the Sgr A Complex (colour image – red: nonthermal Sgr A East, yellow: thermal Sgr A West and the four compact H ii regions of which A is the northernmost, close to our observational position) (Serabyn et al. 1992). The FWHM Herschel 487 and 774 GHz beams, H (northernmost) and V polarizations, for the HOP observations we have carried out are indicated by red and yellow circles, respectively. |
| In the text | |
|
Fig. 2 Line of sight from the Sun to the Sgr A Complex at the Galactic centre cuts through a number of spiral arm features, shown in this sketch, which also indicates their approximate radial velocities with respect to the LSR. Assuming that the distance from the Sun to the Galactic centre is 8 kpc, the estimated distances from the Sun to the spiral arm features are as follows: Local – |
| In the text | |
|
Fig. 3 487 GHz spectrum observed towards the Sgr A +50 km s-1 Cloud, with a linear baseline subtracted. The velocity resolution is 0.9 km s-1. The frequency scale is calibrated for a radial velocity of 45.2 km s-1 for easier identification of the emission lines. (This results in a shift of the frequencies of the absorption lines, which do not originate in the +50 km s-1 Cloud, see text.) |
| In the text | |
|
Fig. 4 498 GHz spectrum observed towards the Sgr A +50 km s-1 Cloud, with a linear baseline subtracted. The velocity resolution is 0.9 km s-1. The frequency scale is calibrated for a radial velocity of 45.2 km s-1 for easier identification of the emission lines. |
| In the text | |
|
Fig. 5 774 GHz spectrum observed towards the Sgr A +50 km s-1 Cloud, with a linear baseline subtracted. The velocity resolution is 1.0 km s-1. The frequency scale is calibrated for a radial velocity of 45.2 km s-1 for easier identification of the emission lines. (This results in a shift of the frequency of the U1 absorption line, which does not originate in the +50 km s-1 cloud, see text.) |
| In the text | |
|
Fig. 6 785 GHz spectrum observed towards the Sgr A +50 km s-1 Cloud, with a linear baseline subtracted. The velocity resolution is 1.0 km s-1. The frequency scale is calibrated for a radial velocity of 45.2 km s-1 for easier identification of the emission lines. |
| In the text | |
|
Fig. 7 All the CH3OH emission lines in the four spectral bands and the C17O (7−6) emission line towards the Sgr A +50 km s-1 Cloud. |
| In the text | |
|
Fig. 8 Upper profile: Herschel H |
| In the text | |
|
Fig. 9 487 and 774 GHz O2 spectra towards the Sgr A +50 km s-1 Cloud, compared with a 557 GHz o-H2O profile observed 44′′ west and 20′′ south of our position. The scale of the H2O profile has been multiplied by 0.05. The channel resolution of both O2 spectra is 0.9 km s-1. |
| In the text | |
|
Fig. 10 487 GHz O2 spectra towards the Sgr A +50 km s-1 Cloud. Horizontal (middle H) and Vertical (lower V) polarisations. The average (upper H+V) of these two profiles is also shown. |
| In the text | |
|
Fig. 11 Population diagram for CH3OH-A (squares) and CH3OH-E (circles). Eu is the energy of the upper level, Cl a constant of the line and W is the integrated main beam line intensity. |
| In the text | |
|
Fig. A.1 Excitation temperature vs. cloud density for the 487 GHz O2 transition resulting from RADEX multi-transition analysis, using three values of kinetic temperature: 30, 60 and 100 K. |
| In the text | |
Current usage metrics show cumulative count of Article Views (full-text article views including HTML views, PDF and ePub downloads, according to the available data) and Abstracts Views on Vision4Press platform.
Data correspond to usage on the plateform after 2015. The current usage metrics is available 48-96 hours after online publication and is updated daily on week days.
Initial download of the metrics may take a while.