Fig. 1
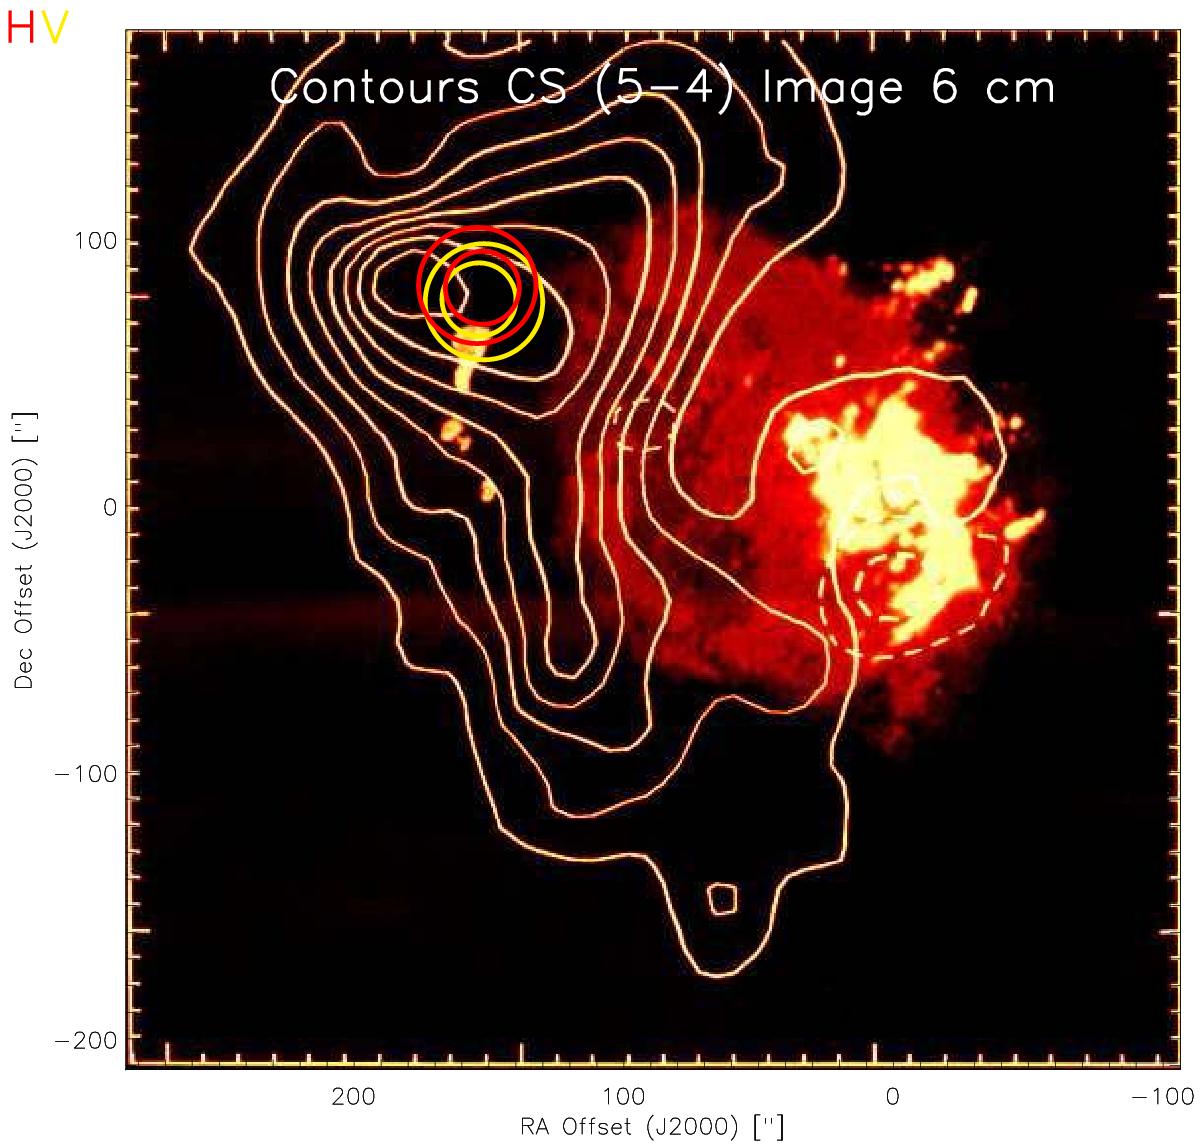
Sgr A +50 km s-1 Cloud, delineated by the integrated emission (+20 to +80 km s-1) in the CS(5−4) line (contours), superimposed upon a 6 cm continuum map of the Sgr A Complex (colour image – red: nonthermal Sgr A East, yellow: thermal Sgr A West and the four compact H ii regions of which A is the northernmost, close to our observational position) (Serabyn et al. 1992). The FWHM Herschel 487 and 774 GHz beams, H (northernmost) and V polarizations, for the HOP observations we have carried out are indicated by red and yellow circles, respectively.
Current usage metrics show cumulative count of Article Views (full-text article views including HTML views, PDF and ePub downloads, according to the available data) and Abstracts Views on Vision4Press platform.
Data correspond to usage on the plateform after 2015. The current usage metrics is available 48-96 hours after online publication and is updated daily on week days.
Initial download of the metrics may take a while.