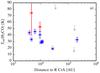
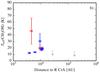
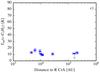
Fig. 9
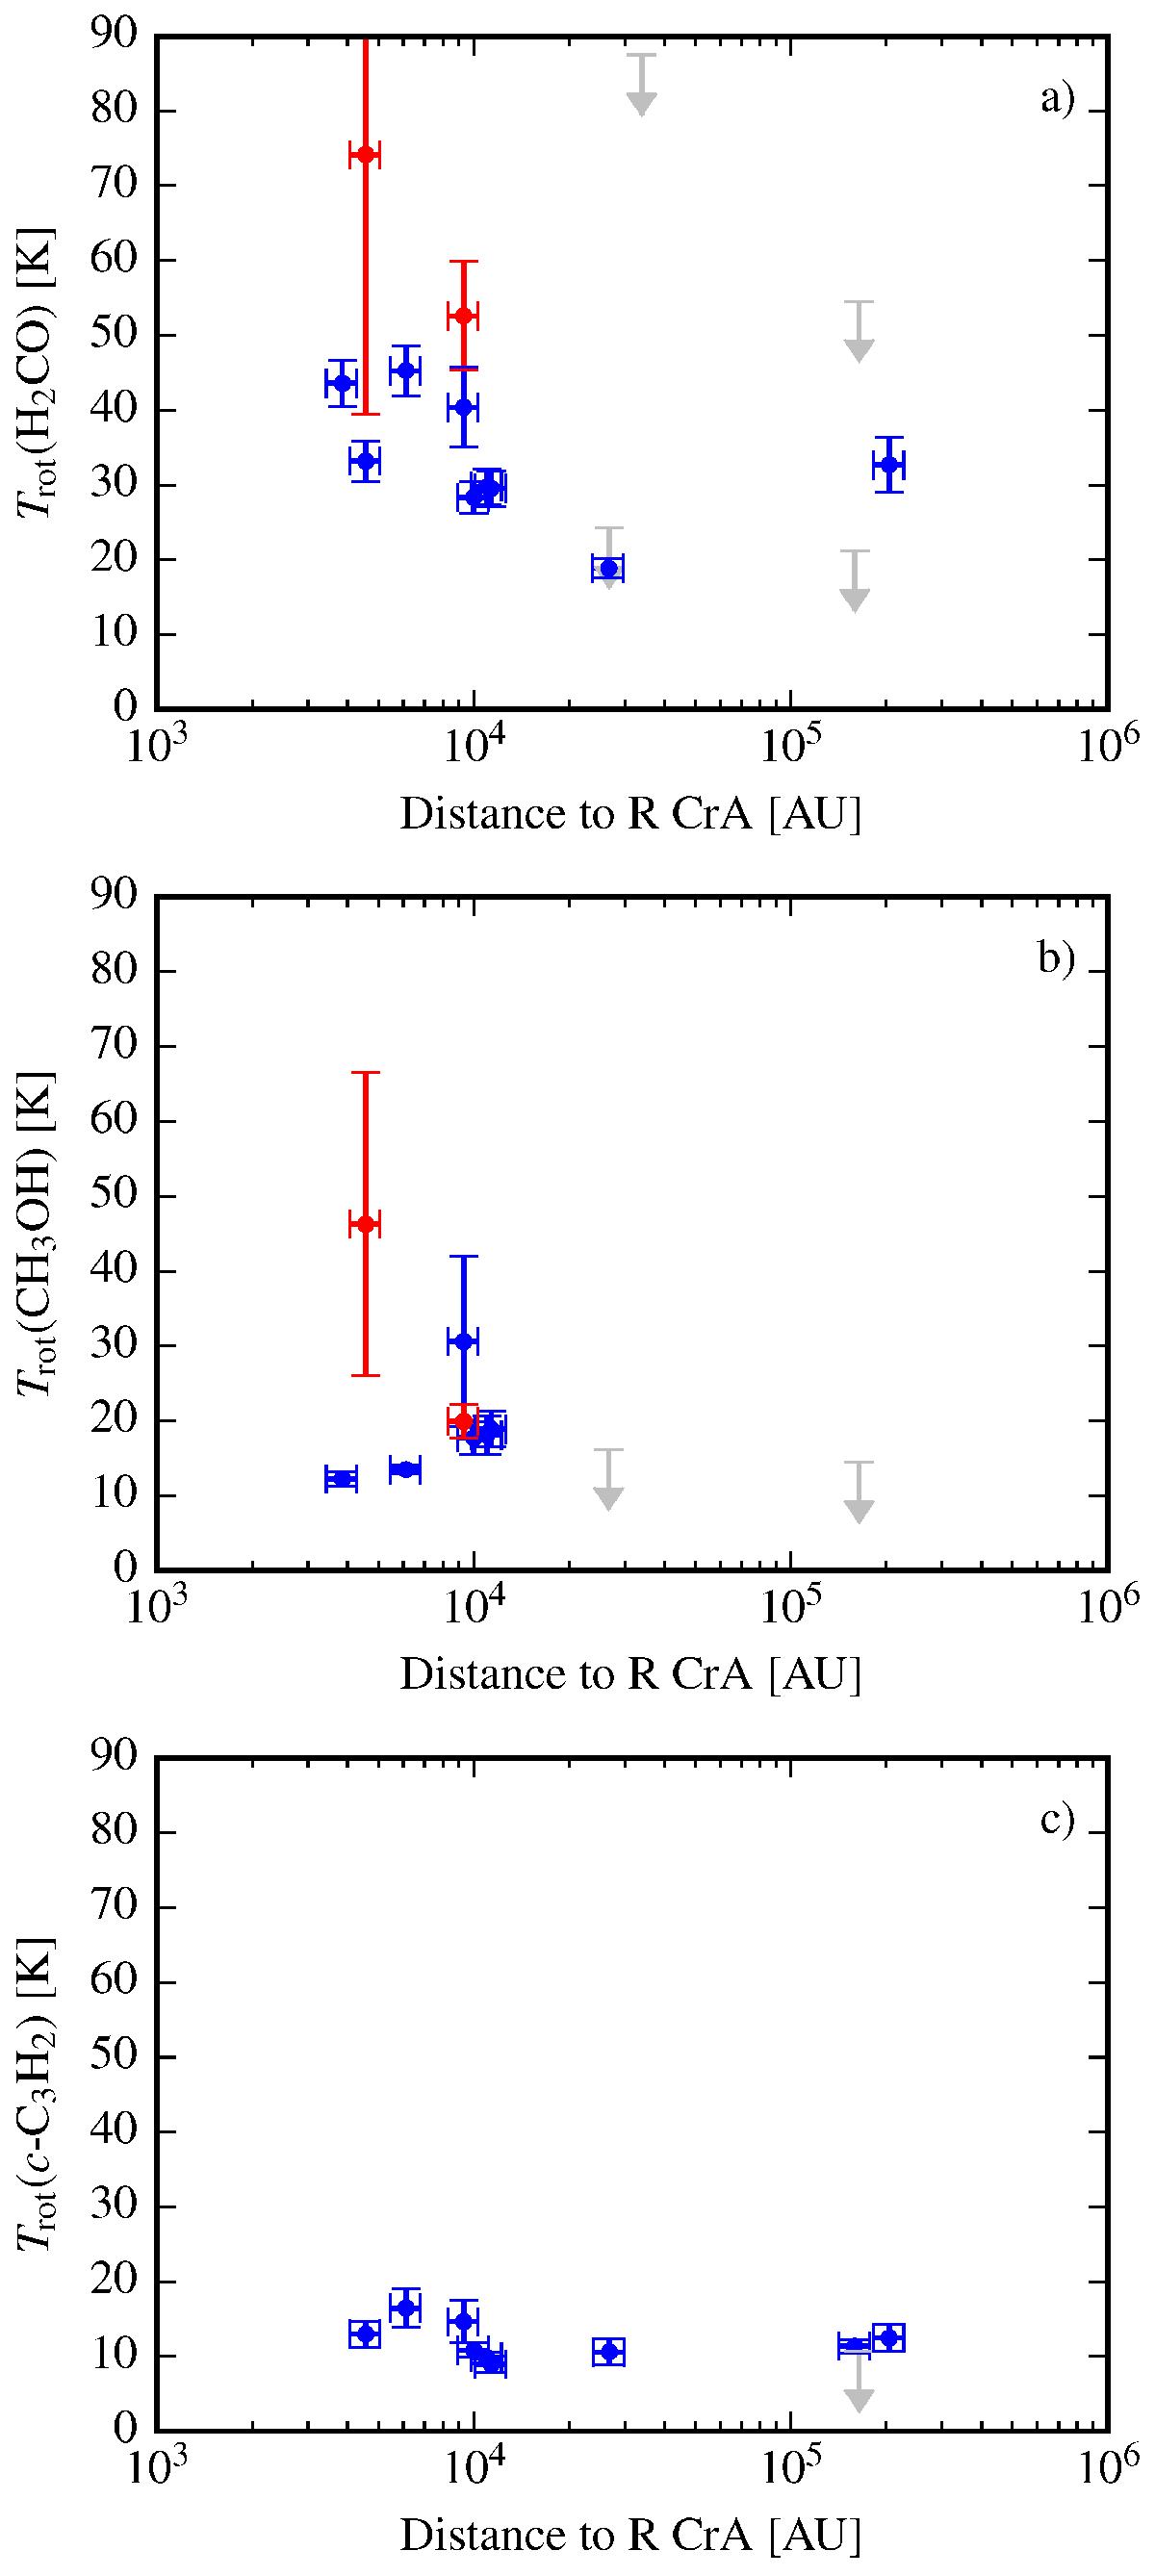
Rotational temperatures for a) H2CO; b) CH3OH; and c)c-C3H2 as functions of distance to R CrA. Upper limits are shown in grey. In the H2CO plot, CrA-24 and SMM 2 have two data points each, one for the on-source component (blue) and one for the outflow component (red), and the same applies to the CH3OH plot when the rotational temperature could be measured. The CH3OH rotational temperature most likely does not reflect a physical temperature due to non-LTE excitation in combination with few data points. (A colour version of this plot is available in the online Journal.)
Current usage metrics show cumulative count of Article Views (full-text article views including HTML views, PDF and ePub downloads, according to the available data) and Abstracts Views on Vision4Press platform.
Data correspond to usage on the plateform after 2015. The current usage metrics is available 48-96 hours after online publication and is updated daily on week days.
Initial download of the metrics may take a while.