Fig. F.2
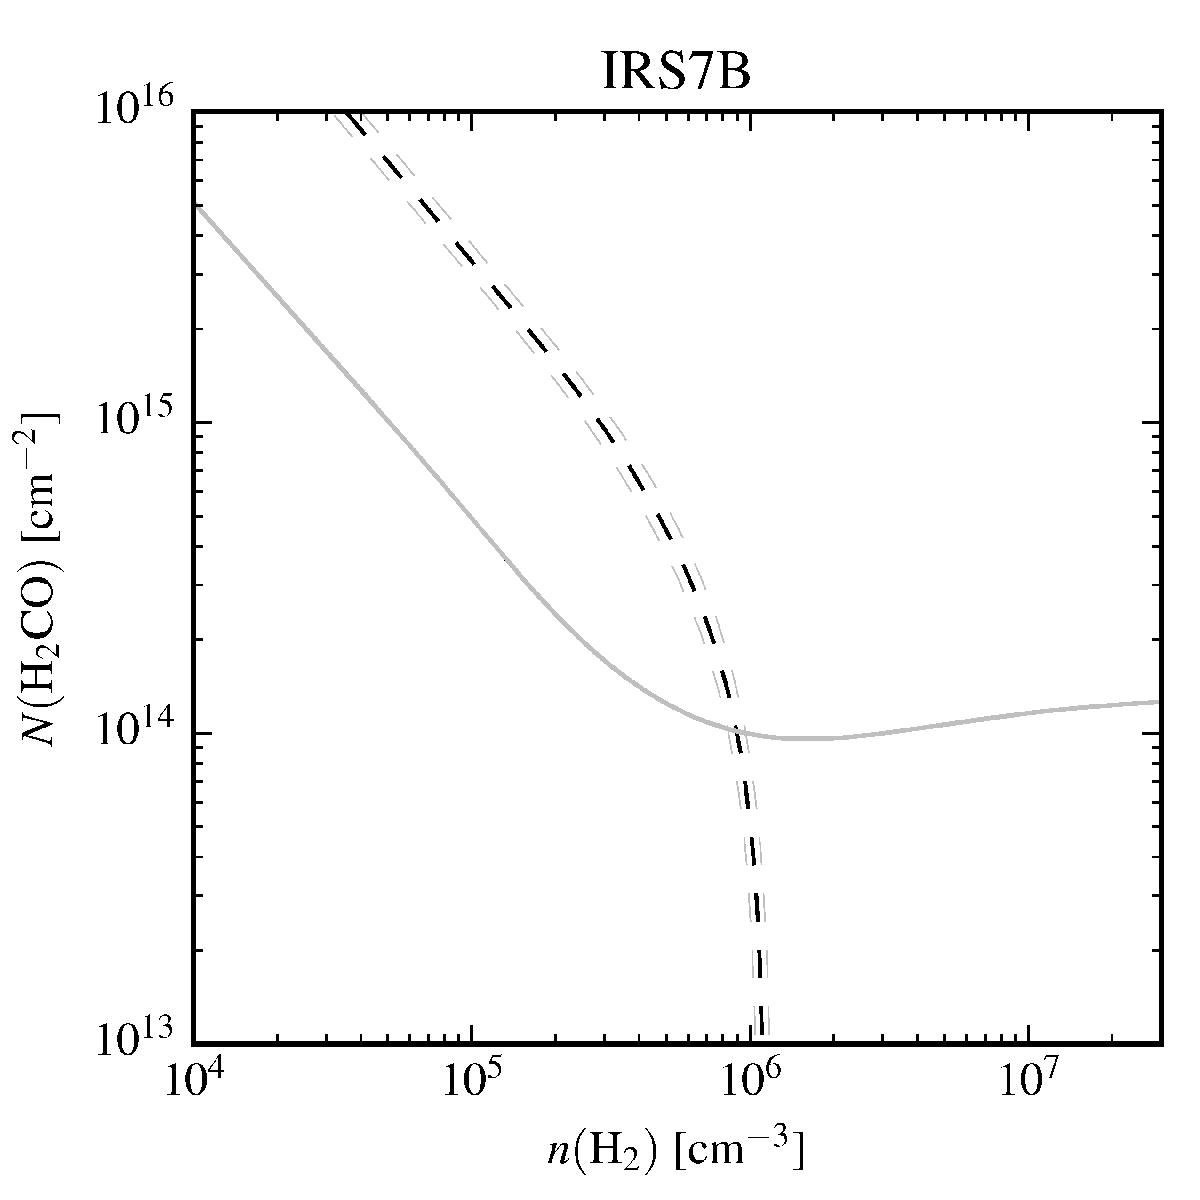
RADEX fit for H2CO in IRS7B, given T = 40 K (from the rotational diagram fit of the full IRS7B survey). The solid line shows the measured 303 → 202 line intensity, and the dashed line is the measured 303 → 202/ 505 → 404 line ratio. 3σ errors are shown as grey lines, but can barely be distinguished from the measured values. When we estimate uncertainties, the errors on the fitted temperatures are also taken into account.
Current usage metrics show cumulative count of Article Views (full-text article views including HTML views, PDF and ePub downloads, according to the available data) and Abstracts Views on Vision4Press platform.
Data correspond to usage on the plateform after 2015. The current usage metrics is available 48-96 hours after online publication and is updated daily on week days.
Initial download of the metrics may take a while.