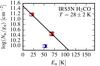
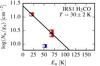
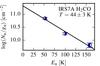
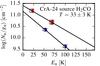
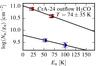
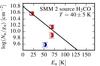
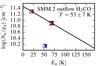
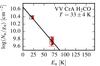
Fig. 6
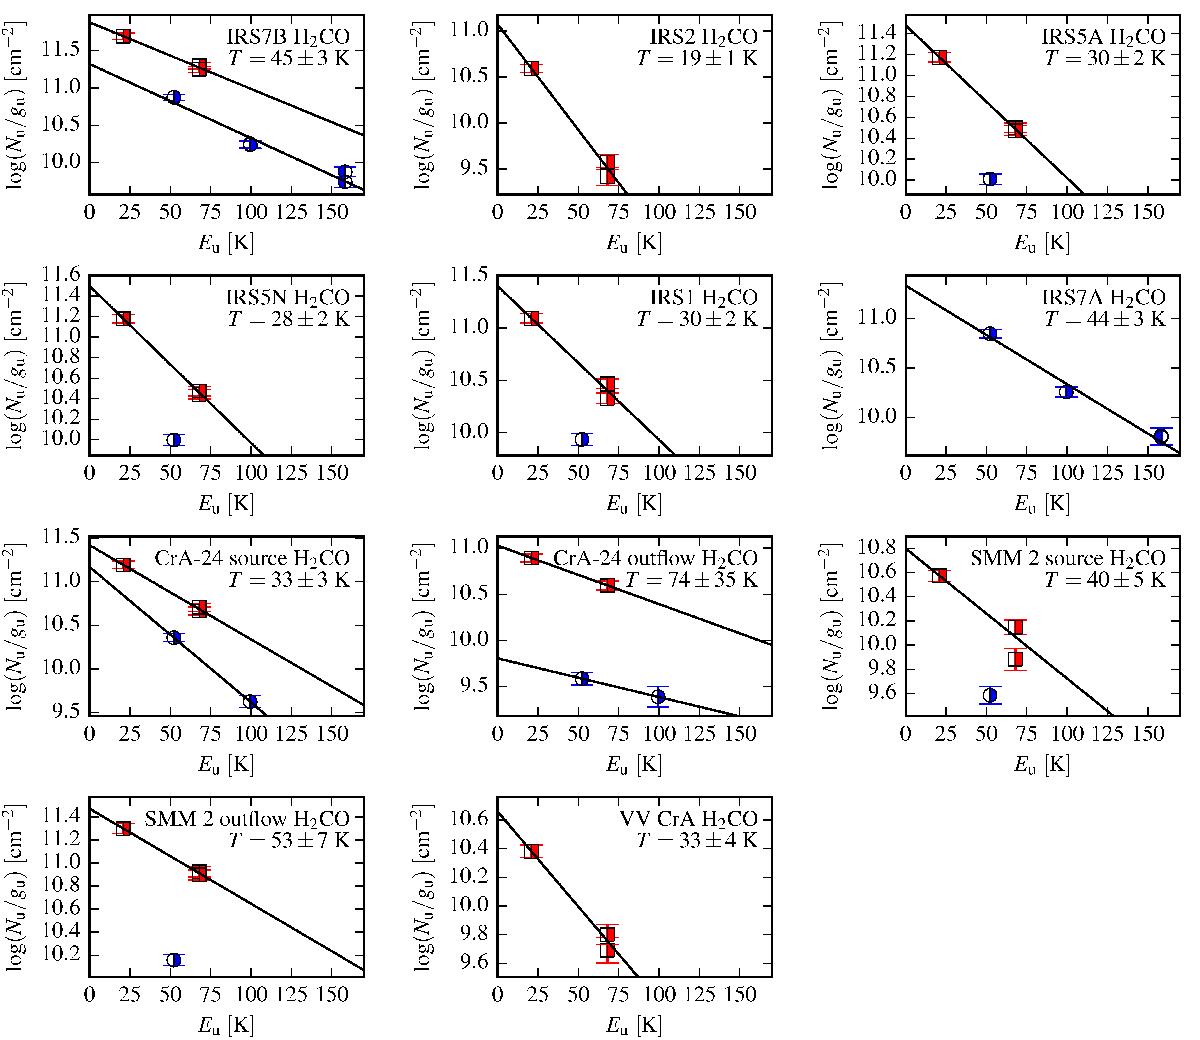
H2CO rotational diagrams of the sources in the CrA survey where at least two H2CO lines were detected. The ortho lines are filled in the left half and the para lines are filled in the right half. Red square data points are 1.3 mm lines and blue circle data points are 0.8 mm lines, all observed with APEX. (A colour version of this plot is available in the online Journal.)
Current usage metrics show cumulative count of Article Views (full-text article views including HTML views, PDF and ePub downloads, according to the available data) and Abstracts Views on Vision4Press platform.
Data correspond to usage on the plateform after 2015. The current usage metrics is available 48-96 hours after online publication and is updated daily on week days.
Initial download of the metrics may take a while.