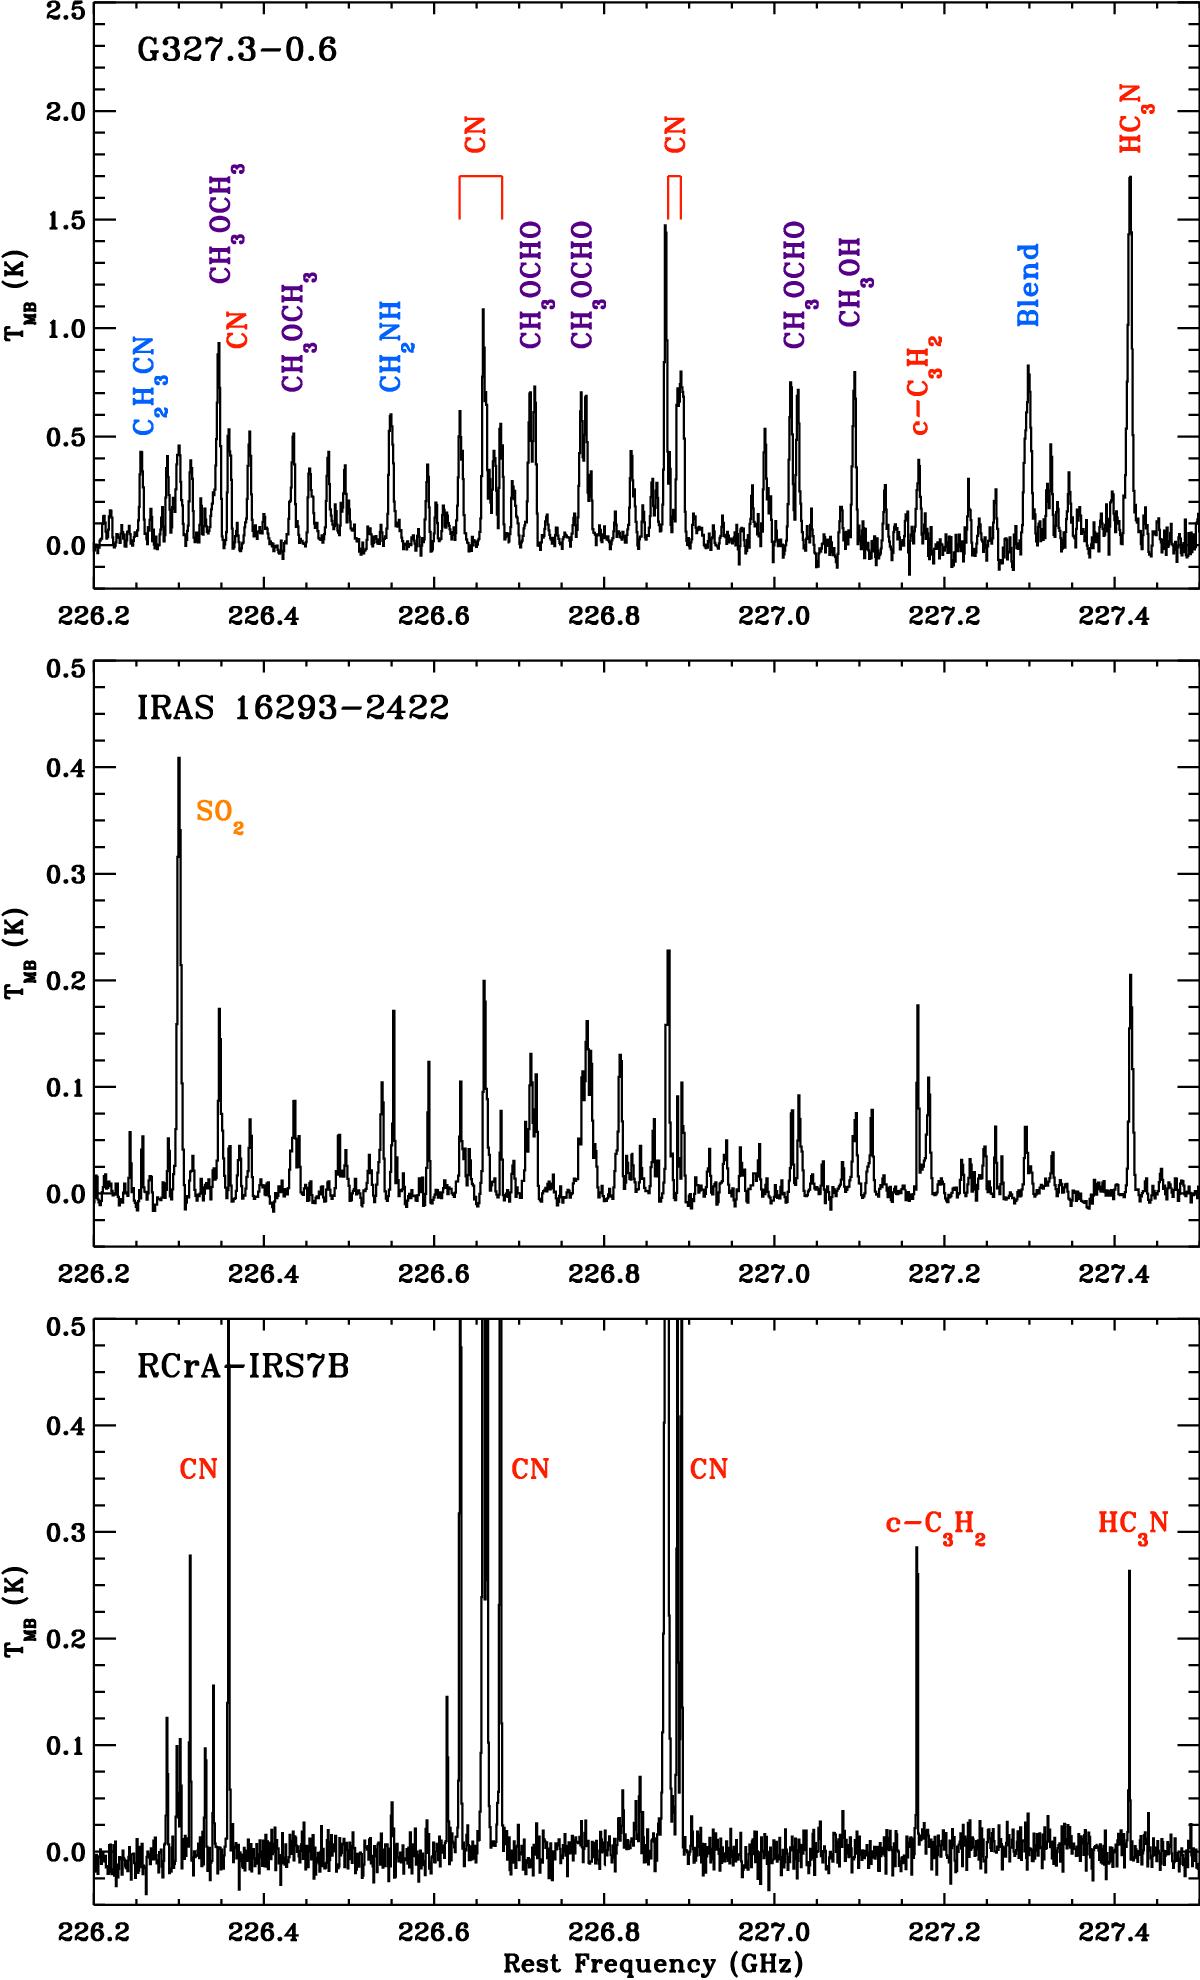
Fig. 3

Single-dish spectra around 227 GHz of the hot core G327.3-0.6 (top; observed with APEX; Bisschop et al. 2013, in prep.), the hot corino IRAS 16293-2422 (middle; observed with IRAM 30 m; Caux et al. 2011), and R CrA IRS7B (bottom; this work). The labels in the upper plot correspond well to the lines also seen in the middle plot. The colours denote oxygen-bearing (purple), nitrogen-bearing (blue), sulphur-bearing (yellow), and typical WCCC and PDR (red) species. (A colour version of this plot is available in the online Journal.)
Current usage metrics show cumulative count of Article Views (full-text article views including HTML views, PDF and ePub downloads, according to the available data) and Abstracts Views on Vision4Press platform.
Data correspond to usage on the plateform after 2015. The current usage metrics is available 48-96 hours after online publication and is updated daily on week days.
Initial download of the metrics may take a while.


