Fig. 14
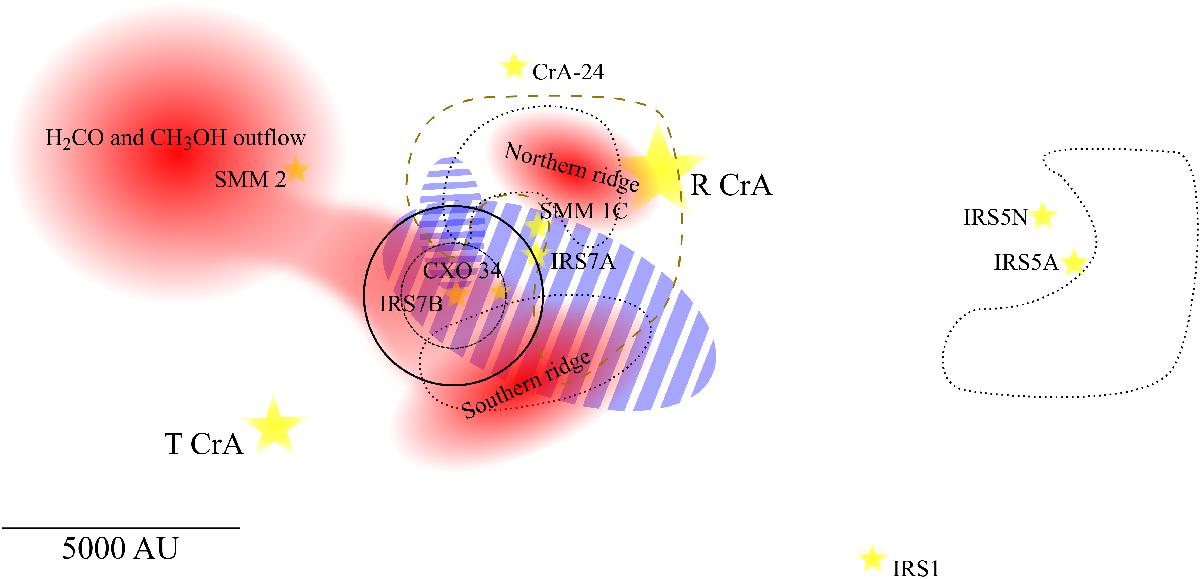
Schematic drawing of the R CrA cloud and its surroundings. Protostars are shown in yellow. Red structures indicate extended H2CO and CH3OH emission, and blue striped structures show extended emission from hydrocarbon and nitrogen-bearing species (Miettinen et al., in prep.; Lindberg & Jørgensen 2012). The brown dashed contour shows extended high-J (J ~ 20) CO emission, and the black dotted contours show extended 110 μm dust continuum emission not associated with the point sources (from Herschel PACS observations; Lindberg et al. 2014b). The solid black circle shows the APEX beam at 218 GHz centred at IRS7B, and the dashed black circle shows the APEX beam at 363 GHz. Large parts of the region have not been covered by all observation modes, and thus the map is probably incomplete. This map covers only a small part of the sources in the CrA source survey (cf. Fig. 1). (A colour version of this plot is available in the online Journal.)
Current usage metrics show cumulative count of Article Views (full-text article views including HTML views, PDF and ePub downloads, according to the available data) and Abstracts Views on Vision4Press platform.
Data correspond to usage on the plateform after 2015. The current usage metrics is available 48-96 hours after online publication and is updated daily on week days.
Initial download of the metrics may take a while.