Fig. 13
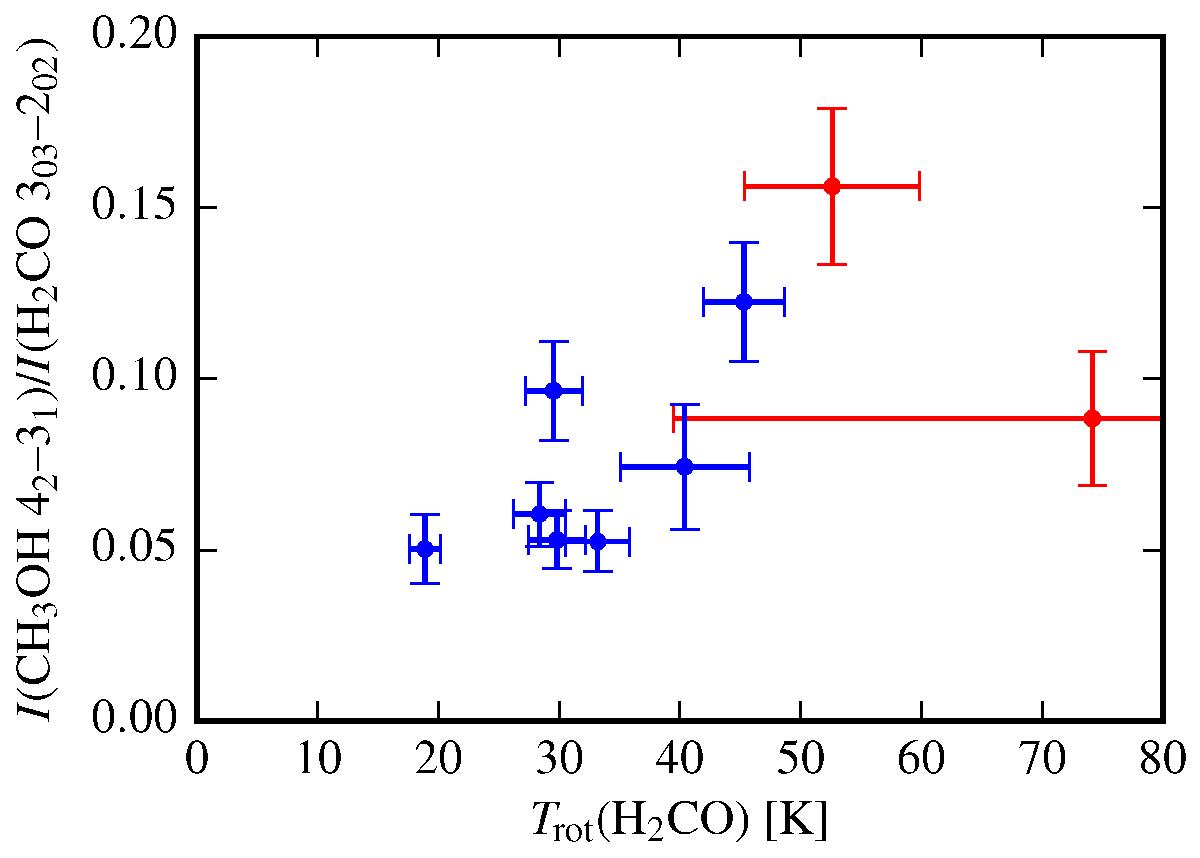
As a proxy for the CH3OH/H2CO abundance ratio, we here show the line ratio between the CH3OH 42 → 31, E line at 218.440 GHz and the H2CO 303 → 202 line at 218.222 GHz in the CrA sources as a function of the H2CO rotational temperature. CrA-24 and SMM 2 are shown with two data points each, one for the on-source component (blue) and one for the outflow component (red). (A colour version of this plot is available in the online Journal.)
Current usage metrics show cumulative count of Article Views (full-text article views including HTML views, PDF and ePub downloads, according to the available data) and Abstracts Views on Vision4Press platform.
Data correspond to usage on the plateform after 2015. The current usage metrics is available 48-96 hours after online publication and is updated daily on week days.
Initial download of the metrics may take a while.