Free Access
Fig. 12
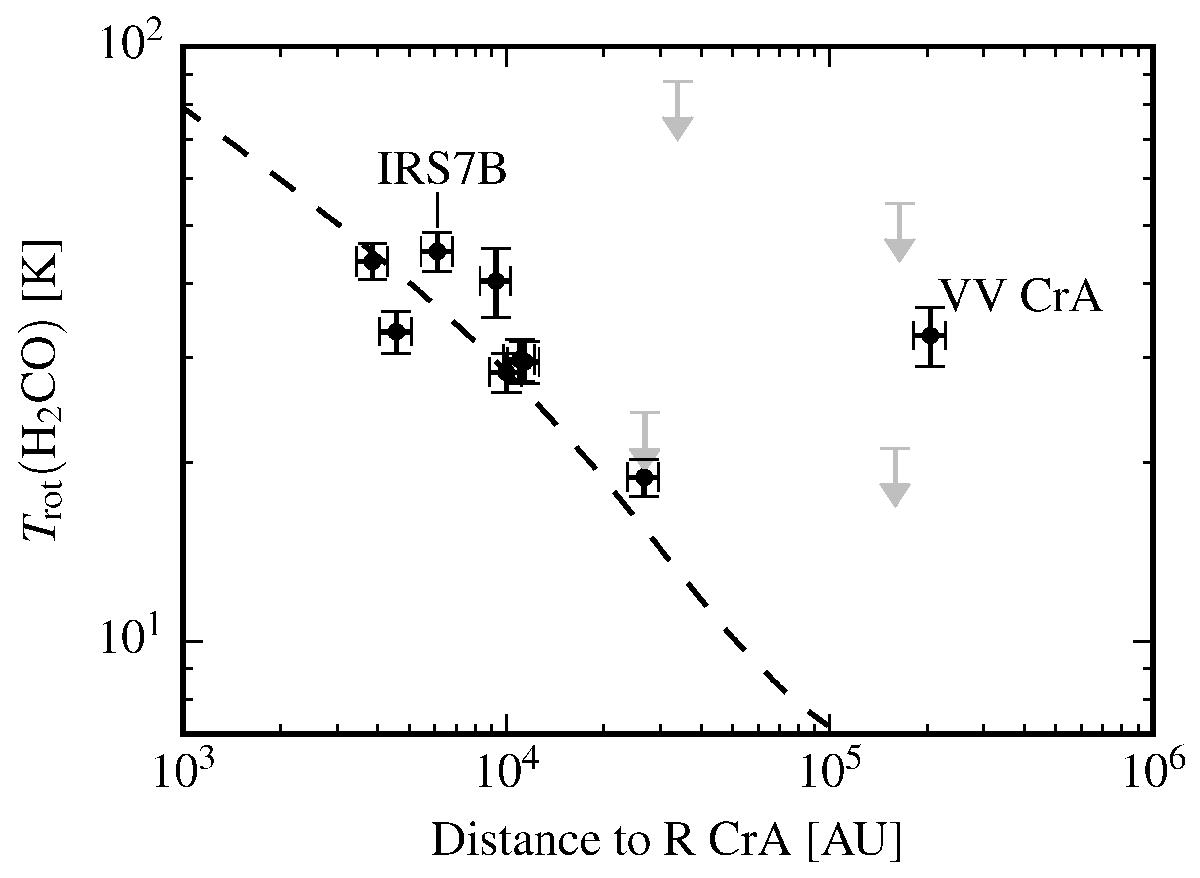
1D radiative transfer model of heating from R CrA (dashed line) plotted together with the H2CO rotational temperatures measured in the CrA sources as a function of distance to R CrA. For CrA-24 and SMM 2, only the on-source components are shown. Upper limits are shown in grey. See also Fig. 9a.
Current usage metrics show cumulative count of Article Views (full-text article views including HTML views, PDF and ePub downloads, according to the available data) and Abstracts Views on Vision4Press platform.
Data correspond to usage on the plateform after 2015. The current usage metrics is available 48-96 hours after online publication and is updated daily on week days.
Initial download of the metrics may take a while.