Fig. 11
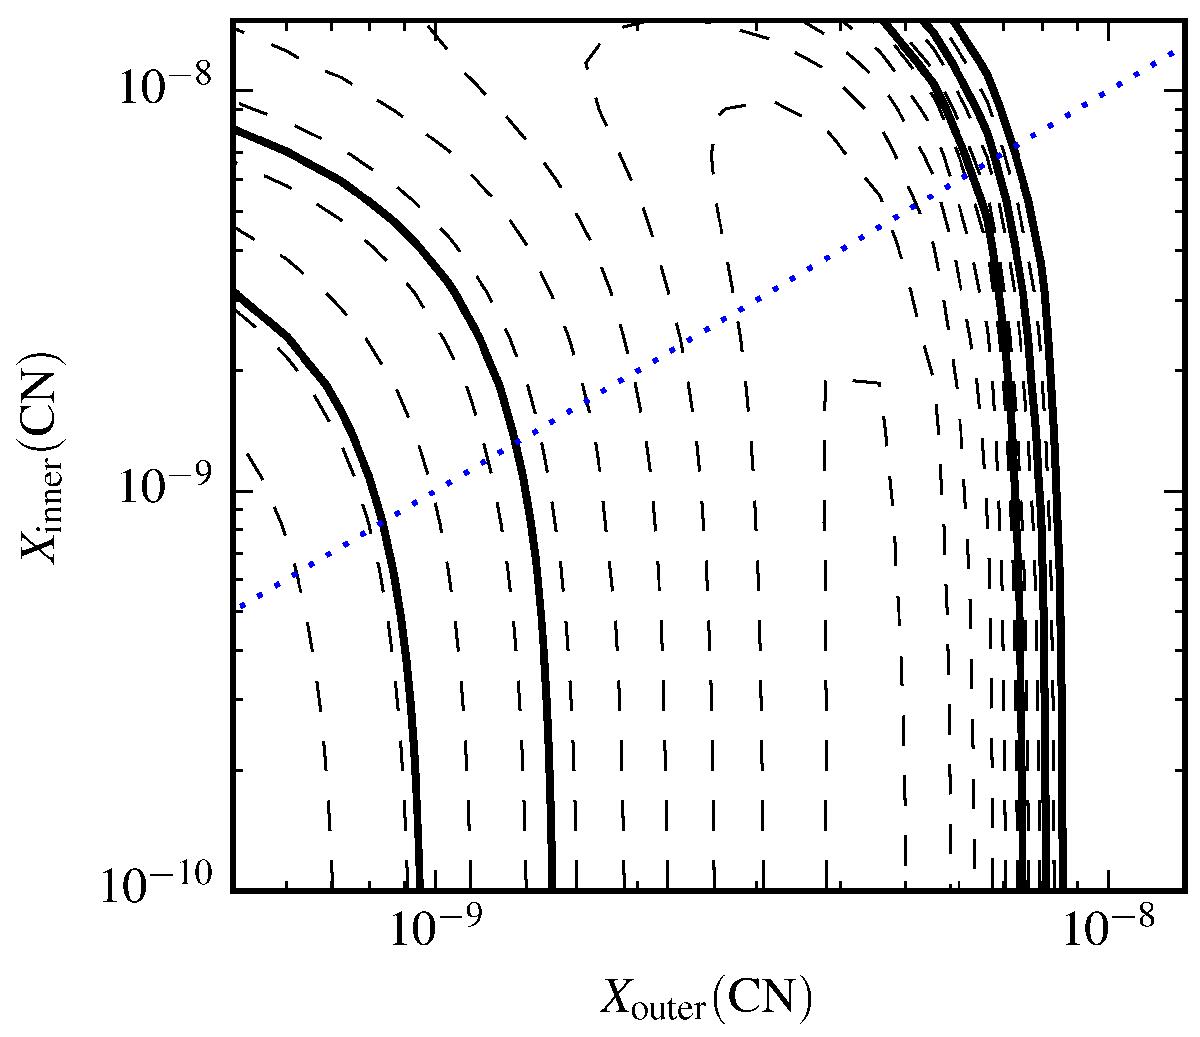
Reduced-χ2 fit to the CN abundance. The solid lines show the 1σ, 2σ, and 3σ confidence levels. The dashed lines show the reduced-χ2 values in steps of 5. The border between inner and outer abundance lies where the temperature falls below 30 K, which occurs at 370 AU. The blue dotted line shows the values for equal inner and outer abundances. (A colour version of this plot is available in the online Journal.)
Current usage metrics show cumulative count of Article Views (full-text article views including HTML views, PDF and ePub downloads, according to the available data) and Abstracts Views on Vision4Press platform.
Data correspond to usage on the plateform after 2015. The current usage metrics is available 48-96 hours after online publication and is updated daily on week days.
Initial download of the metrics may take a while.