Fig. 10
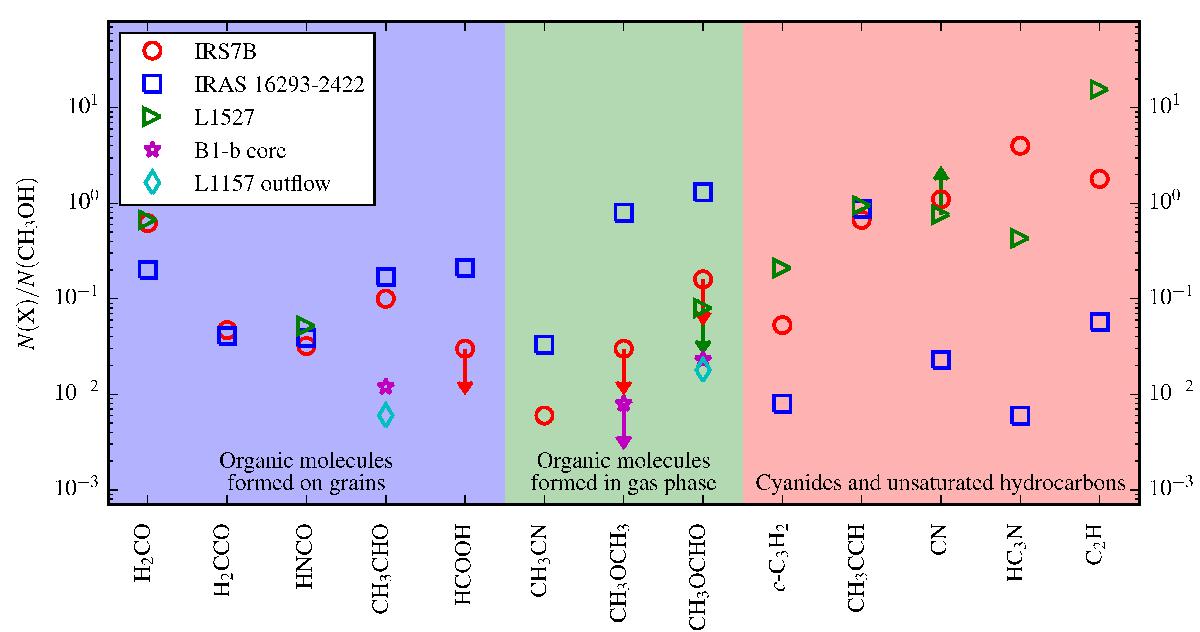
Graphical representation of molecular abundances relative to the CH3OH abundance as given in Table 6 for IRS7B, the hot corino source IRAS 16293-2422, the WCCC source L1527, the quiescent protostar B1-b, and the L1157 outflow. See the notes of Table 6 for references. For a discussion on the classification of gas and grain formation of the organic species, see Charnley (1997, 2001). (A colour version of this plot is available in the online Journal.)
Current usage metrics show cumulative count of Article Views (full-text article views including HTML views, PDF and ePub downloads, according to the available data) and Abstracts Views on Vision4Press platform.
Data correspond to usage on the plateform after 2015. The current usage metrics is available 48-96 hours after online publication and is updated daily on week days.
Initial download of the metrics may take a while.