Fig. 1
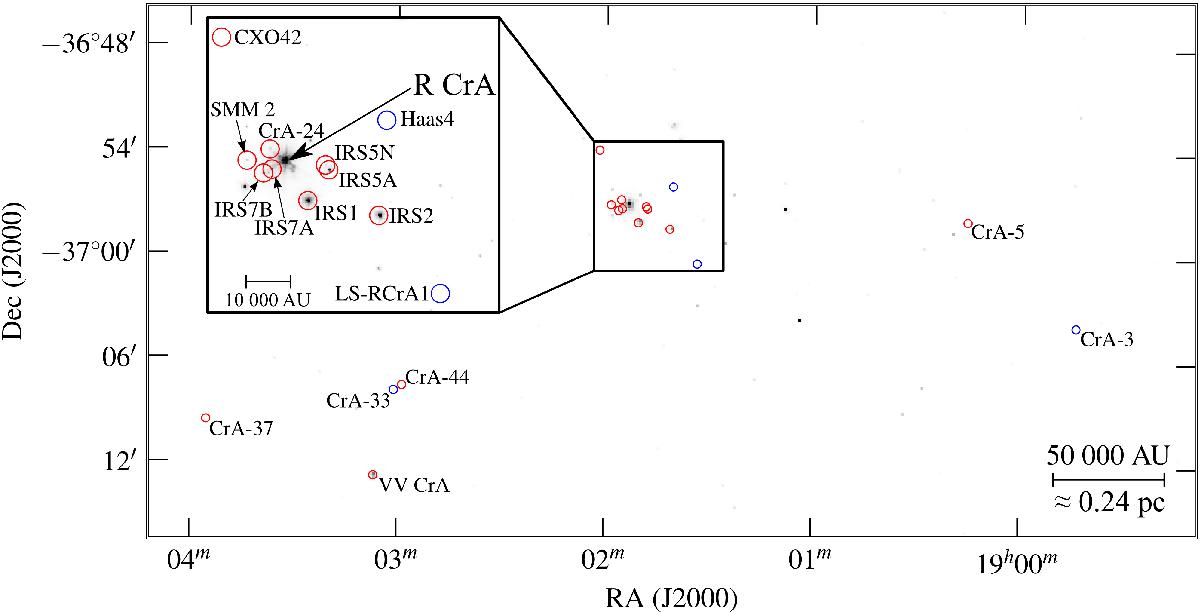
Overview of the observed sources in the H2CO, CH3OH, and c-C3H2 survey. The circles show the APEX beam size in the 1.4 mm window. Red circles denote Class 0/I objects and blue circles are flat-spectrum sources. CrA-46 is located ~40′ (~1.5 pc) west of the right edge of the plot. The inset shows a zoom-in of the region around R CrA enlarged by a factor ~2. The greyscale background is a Spitzer 4.5 μm image. (A colour version of this plot is available in the online Journal.)
Current usage metrics show cumulative count of Article Views (full-text article views including HTML views, PDF and ePub downloads, according to the available data) and Abstracts Views on Vision4Press platform.
Data correspond to usage on the plateform after 2015. The current usage metrics is available 48-96 hours after online publication and is updated daily on week days.
Initial download of the metrics may take a while.