Fig. 8
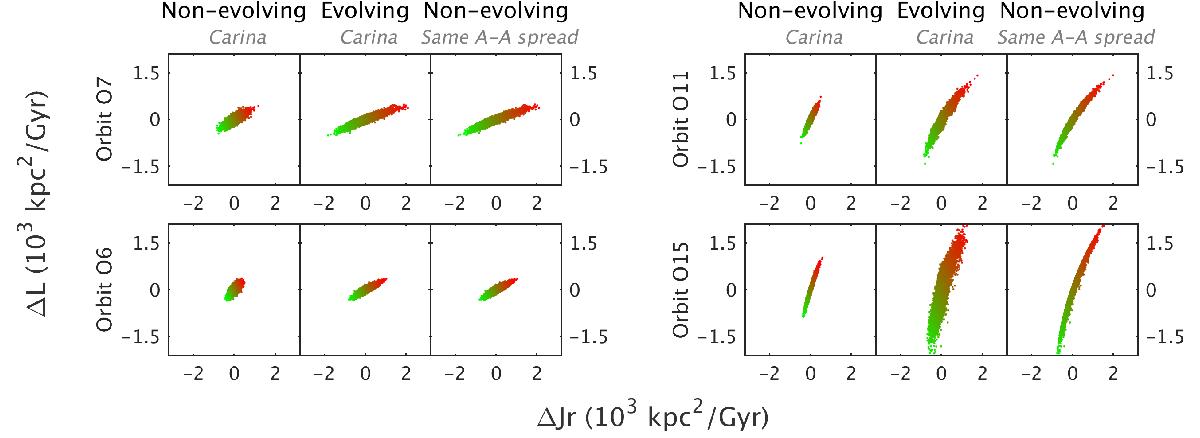
Action-space distributions for a sample of four streams from Fig. 6, measured with respect to the centre of mass of the progenitor at the final time. The colours of the particles represent the energy gradient, such that green is the leading arm and red the trailing arm. In the static cases, the initial and final distributions coincide exactly, but in the time-dependent case there can be small deviations if the orbit is not in the adiabatic regime, as can be seen by comparing the middle and right panels for orbits O11 and O15. The left panels show a smaller spread because the time-dependent cases start farther outwards and in an initially much lighter potential.
Current usage metrics show cumulative count of Article Views (full-text article views including HTML views, PDF and ePub downloads, according to the available data) and Abstracts Views on Vision4Press platform.
Data correspond to usage on the plateform after 2015. The current usage metrics is available 48-96 hours after online publication and is updated daily on week days.
Initial download of the metrics may take a while.