Fig. 5
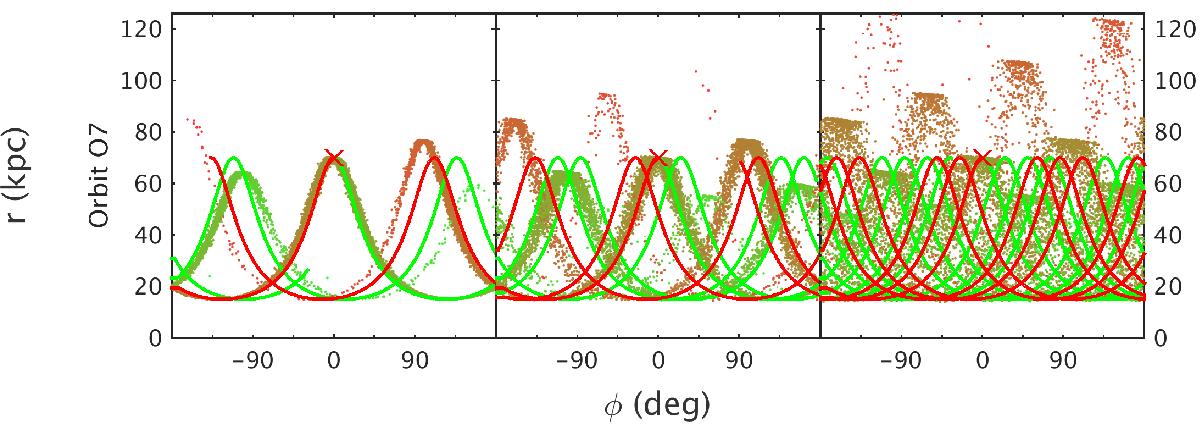
Radial vs. angular distribution of particles in the orbital plane for experiment O7 for the different progenitors in the time-dependent case. The dashed curves show the orbit of the centre of mass of the system integrated long enough to roughly reproduce the lengths of the streams. The variations in the apocentric distances are a reflection both of time evolution and of the energy gradient present along a stream. The difference in angular location of the apocentre, on the other hand, is a clear imprint of time evolution, as can be seen by comparing to e.g. Fig. 7.
Current usage metrics show cumulative count of Article Views (full-text article views including HTML views, PDF and ePub downloads, according to the available data) and Abstracts Views on Vision4Press platform.
Data correspond to usage on the plateform after 2015. The current usage metrics is available 48-96 hours after online publication and is updated daily on week days.
Initial download of the metrics may take a while.