Fig. 18
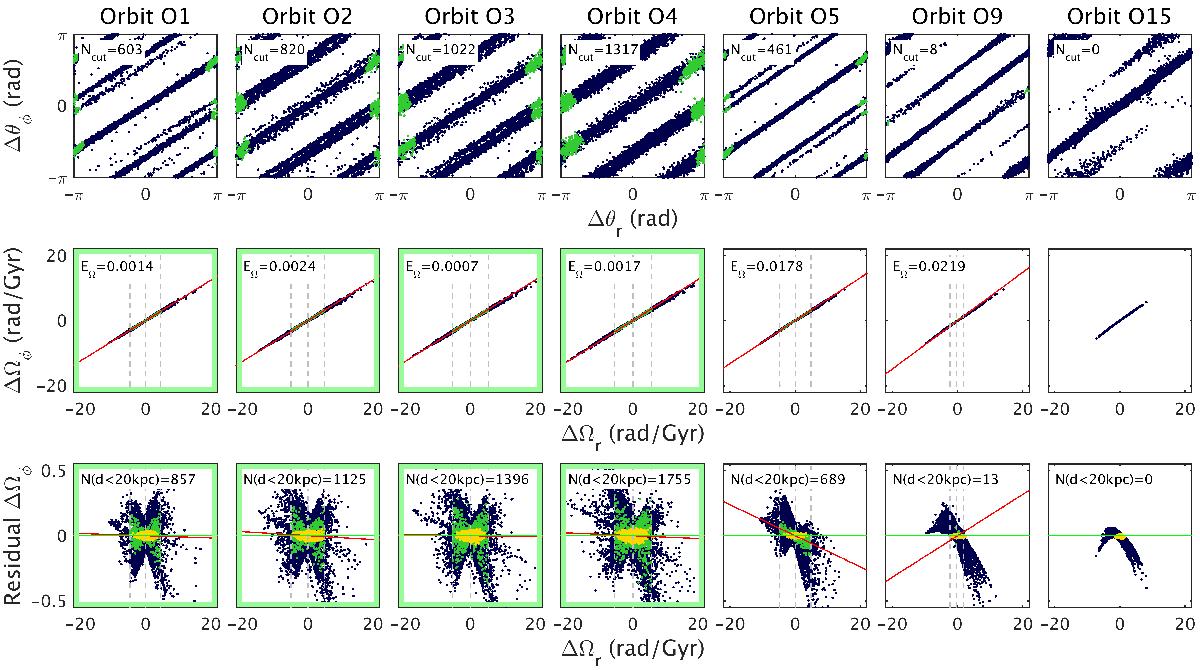
Selection of the orbits of Fig. 16 with 10% parallax errors, but now with two cuts: σd ≤ 2 kpc and | Ωr−⟨Ωr⟩ | ≤ SDΩr. The colours are the same as in Fig. 17, with the addition that green points represent the particles that remain after the cuts. The grey vertical dashed lines indicate ⟨Ωr⟩ and ⟨Ωr⟩ ± SDΩr applied after the distance cut. The insets in the top panels show the number of remaining particles after the cuts Ncut, while those in the bottom panels are the number of particles within a distance of 20 kpc from the Sun N (d< 20 kpc).
Current usage metrics show cumulative count of Article Views (full-text article views including HTML views, PDF and ePub downloads, according to the available data) and Abstracts Views on Vision4Press platform.
Data correspond to usage on the plateform after 2015. The current usage metrics is available 48-96 hours after online publication and is updated daily on week days.
Initial download of the metrics may take a while.