Fig. 16
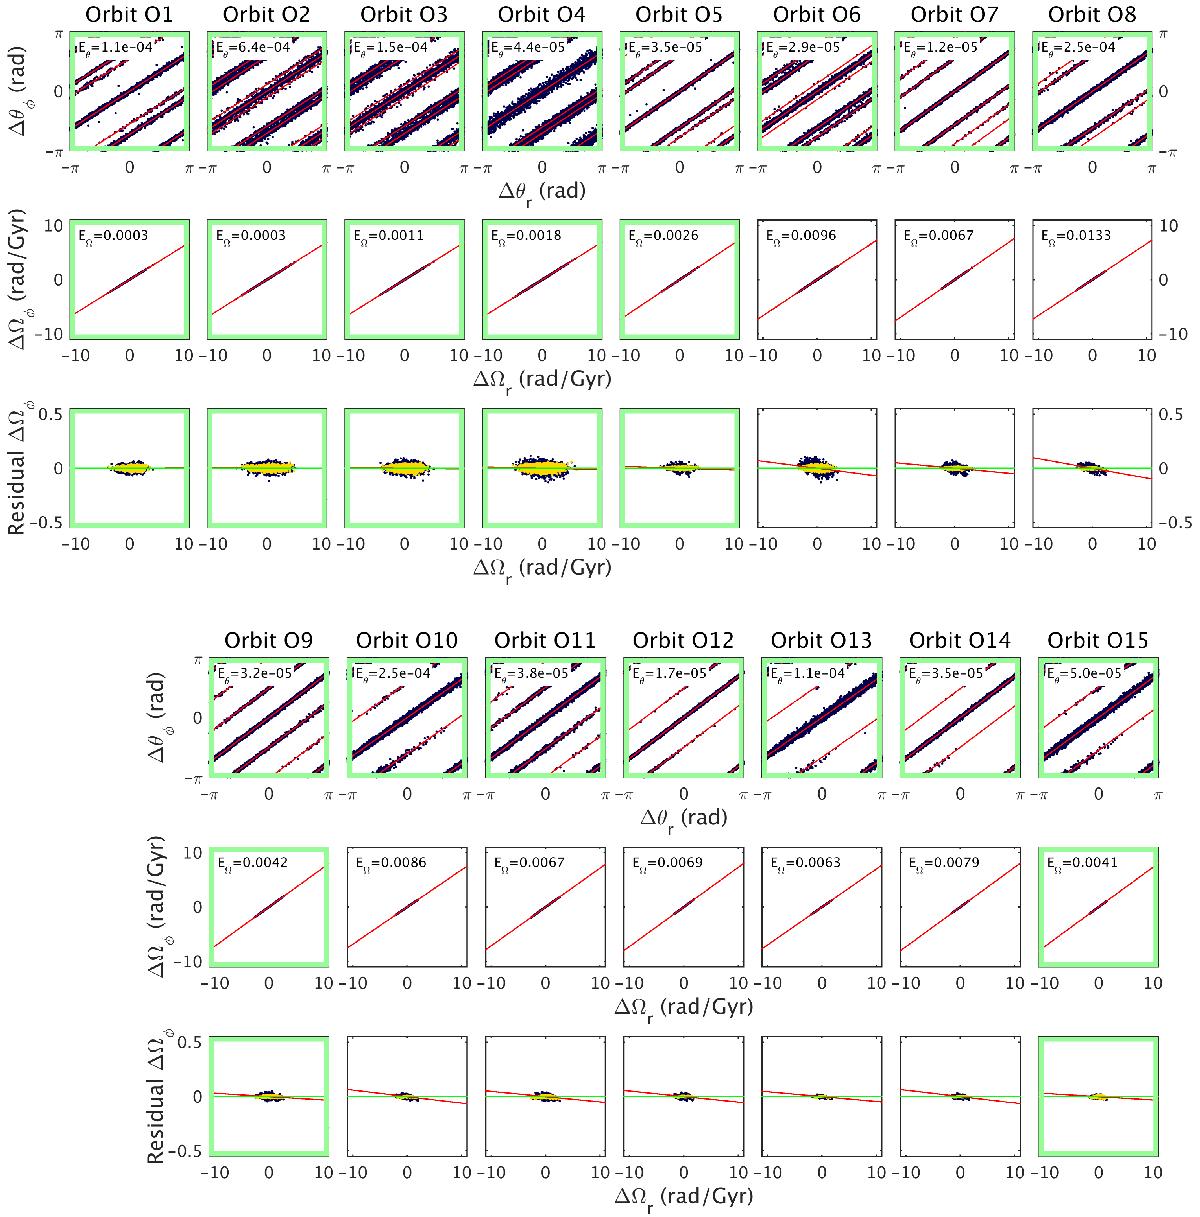
Angle and frequency space plots and residuals of the frequency space fits of all 15 streams for 1% distance (and proper motion) errors in the time-dependent potential. The streams are centred on the position of the centre of mass of the progenitor in the error-free case. The black points are error-convolved, while those in yellow are error-free and only shown in the bottom row. The residuals were computed by subtracting the best-fit straight line to the error-free frequency distribution (green line) from ΔΩφ. The text in the panels shows the relative difference in the slopes for the error-convolved and error-free cases derived in angle space Eθ and in frequency space EΩ (i.e. using the red vs. green straight lines, respectively). The panels for which Ei< 0.005 are marked with a green box. The difference in slope in angle space clearly is generally far below this value, while the frequencies are much more strongly affected by the errors.
Current usage metrics show cumulative count of Article Views (full-text article views including HTML views, PDF and ePub downloads, according to the available data) and Abstracts Views on Vision4Press platform.
Data correspond to usage on the plateform after 2015. The current usage metrics is available 48-96 hours after online publication and is updated daily on week days.
Initial download of the metrics may take a while.