Fig. 15
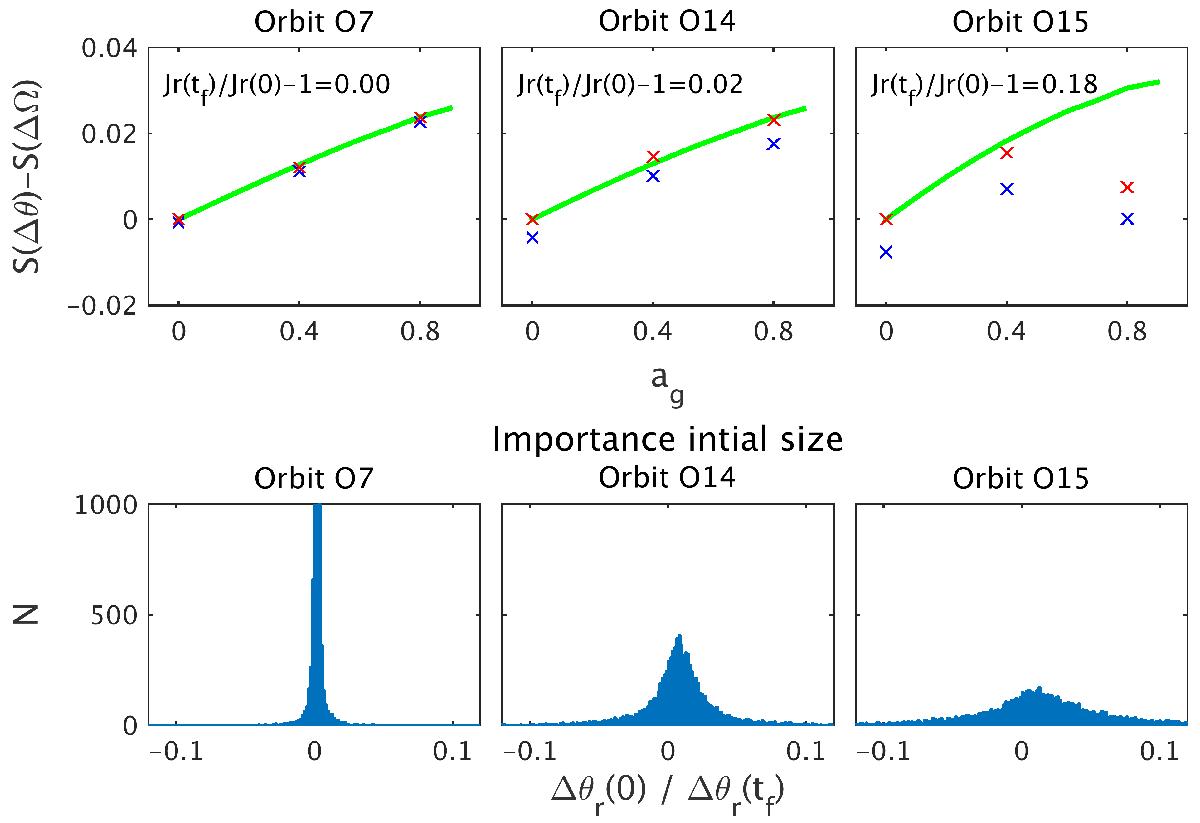
Examples of the slope differences between the angle and frequency distributions (top panels) and histograms of the spread of Δθr(0)/Δθr(tf) (bottom panels). In the top panels, the blue crosses indicate values from the full simulation, while the green lines are the predictions from our analytic model. The red crosses are the slopes measured when the initial spreads from the simulations are removed. All orbits now align with the model when ag = 0. For large ag the more circular orbits such as orbit O15 deviate strongly from the model because of non-adiabaticity.
Current usage metrics show cumulative count of Article Views (full-text article views including HTML views, PDF and ePub downloads, according to the available data) and Abstracts Views on Vision4Press platform.
Data correspond to usage on the plateform after 2015. The current usage metrics is available 48-96 hours after online publication and is updated daily on week days.
Initial download of the metrics may take a while.