Fig. 9
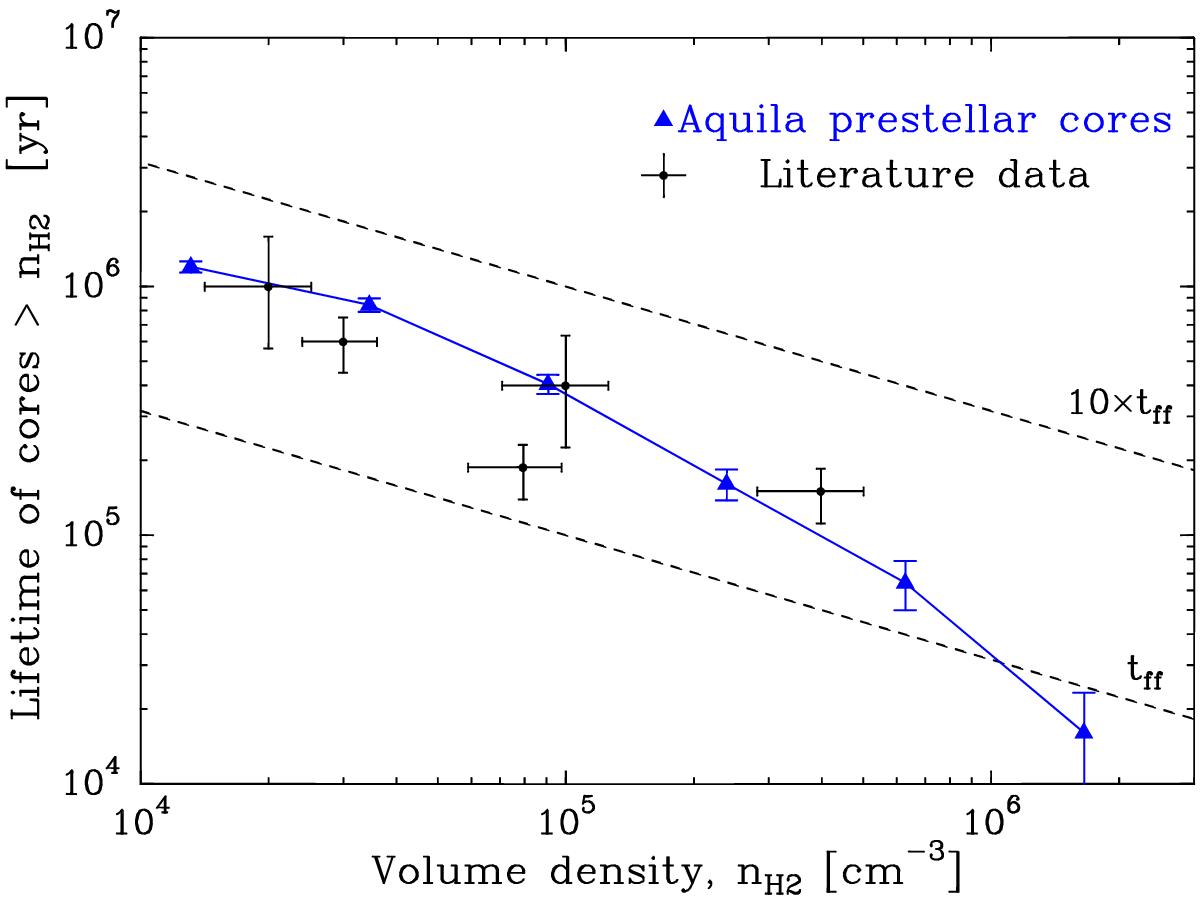
Estimated lifetime against minimum average volume density (blue solid line and filled triangles) for the population of 446 candidate prestellar cores identified with Herschel in the Aquila cloud (blue triangles), similar to the “JWT” plot introduced by Jessop & Ward-Thompson (2000). The error bars only reflect ![]() counting uncertainties. Literature data from Ward-Thompson et al. (2007) are shown as black crosses for comparison. The two parallel dashed lines correspond to the free-fall timescale (tff) and a rough approximation of the ambipolar diffusion timescale (10 × tff). (Color figure is available in the online version.)
counting uncertainties. Literature data from Ward-Thompson et al. (2007) are shown as black crosses for comparison. The two parallel dashed lines correspond to the free-fall timescale (tff) and a rough approximation of the ambipolar diffusion timescale (10 × tff). (Color figure is available in the online version.)
Current usage metrics show cumulative count of Article Views (full-text article views including HTML views, PDF and ePub downloads, according to the available data) and Abstracts Views on Vision4Press platform.
Data correspond to usage on the plateform after 2015. The current usage metrics is available 48-96 hours after online publication and is updated daily on week days.
Initial download of the metrics may take a while.