Fig. 8
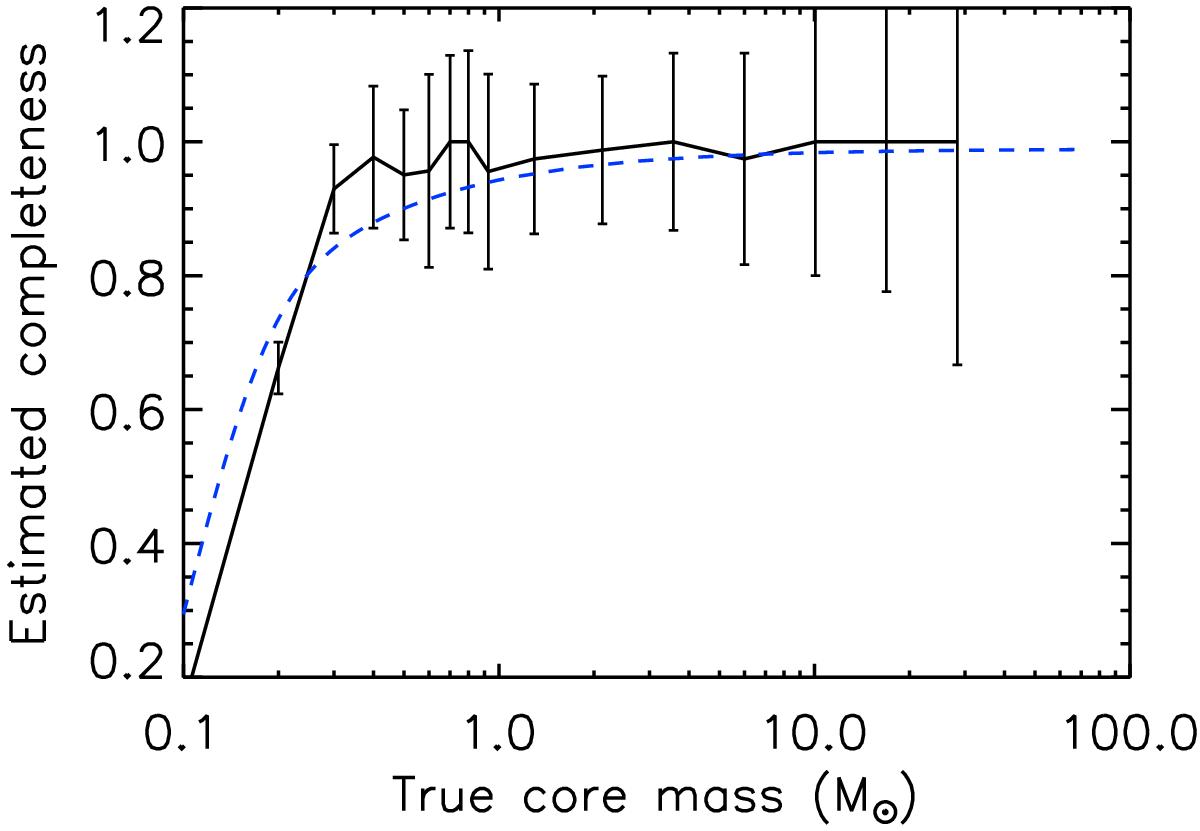
Completeness curve of our Herschel sample of candidate prestellar cores as a function of true core mass (solid line), as estimated from the Monte-Carlo simulations described in Sect. 4.8 and Appendix B.1. For comparison, the dashed line shows the global completeness curve predicted by the model discussed in Appendix B.2. (Color figure is available in the online version.)
Current usage metrics show cumulative count of Article Views (full-text article views including HTML views, PDF and ePub downloads, according to the available data) and Abstracts Views on Vision4Press platform.
Data correspond to usage on the plateform after 2015. The current usage metrics is available 48-96 hours after online publication and is updated daily on week days.
Initial download of the metrics may take a while.