Fig. 7
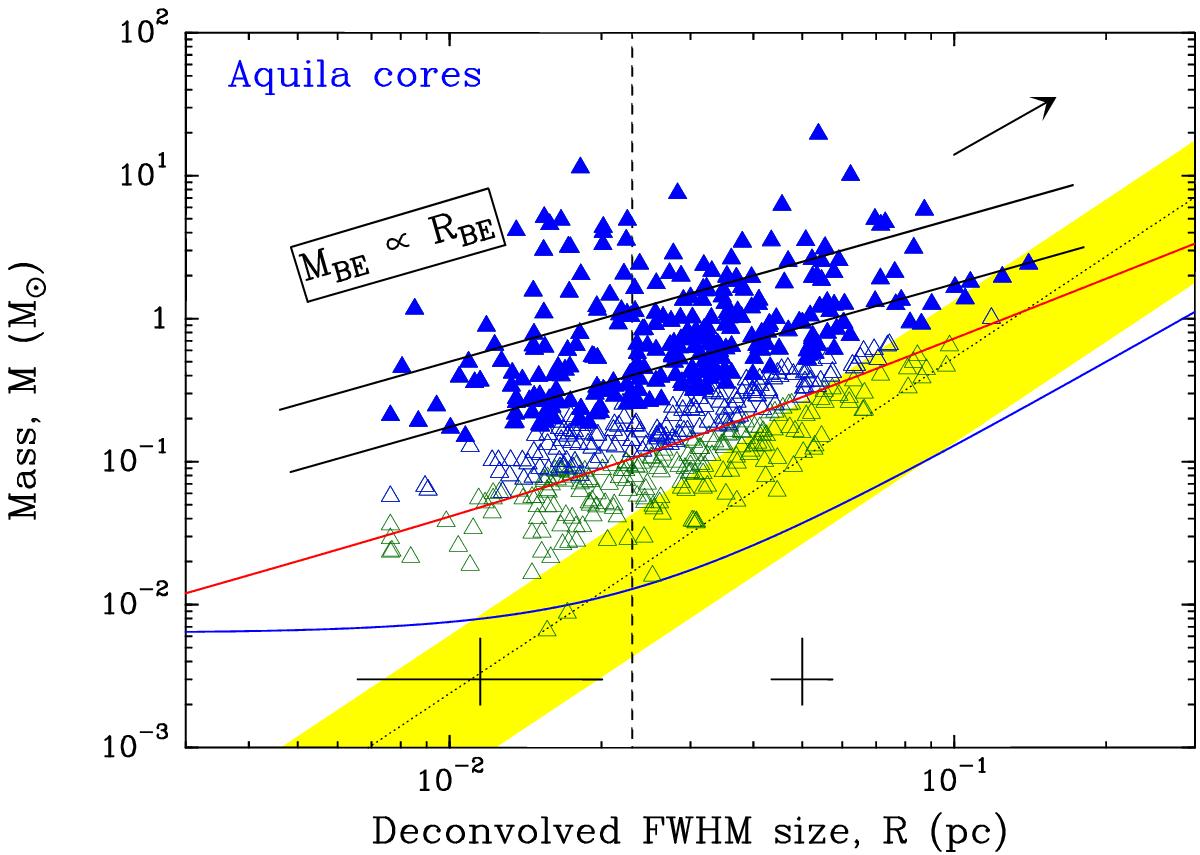
Mass versus size diagram for the entire population of 651 starless cores identified with Herschel in the Aquila cloud. The core FWHM sizes were measured with getsources in the high-resolution column density map (Fig. 1) and deconvolved from an 18.2″ (HPBW) Gaussian beam; the vertical dashed line marks the corresponding physical ![]() resolution at d = 260 pc. The core masses were derived as explained in Sect. 4.6. Typical error bars are shown for both well-resolved and marginally-resolved cores (to the right and the left of the vertical dashed line, respectively). The 292 robust prestellar cores (for which αBE ≤ 2 – see text) are shown as filled blue triangles, the other (candidate) prestellar cores as open blue triangles, and the rest of the starless cores as open green triangles. The red curve shows the empirical lower envelope used to select the 446 candidate prestellar cores in the diagram (i.e., αBE ≤ 5 × (HPBWNH2/FWHMNH2)0.4 – see text), based on the Monte-Carlo simulations described in Sect. 4.8 and Appendix B. For comparison, models of critical isothermal Bonnor-Ebert spheres at T = 7 K and T = 20 K are plotted as black solid lines. The mass–size correlation observed for diffuse CO clumps (Elmegreen & Falgarone 1996) is displayed as a shaded yellow band. The blue curve marks a column density level corresponding to 5 × NH2,rms, where NH2,rms is the typical rms level of cirrus noise fluctuations at AV ~ 7 in the column density map (see Fig. B.4 and Eq. (B.1)). The arrow at the upper right indicates how the Herschel cores (and the blue curve marking the cirrus noise level) would move in the diagram using a distance of 415 pc instead of 260 pc (see Appendix C). (Color figure is available in the online version.)
resolution at d = 260 pc. The core masses were derived as explained in Sect. 4.6. Typical error bars are shown for both well-resolved and marginally-resolved cores (to the right and the left of the vertical dashed line, respectively). The 292 robust prestellar cores (for which αBE ≤ 2 – see text) are shown as filled blue triangles, the other (candidate) prestellar cores as open blue triangles, and the rest of the starless cores as open green triangles. The red curve shows the empirical lower envelope used to select the 446 candidate prestellar cores in the diagram (i.e., αBE ≤ 5 × (HPBWNH2/FWHMNH2)0.4 – see text), based on the Monte-Carlo simulations described in Sect. 4.8 and Appendix B. For comparison, models of critical isothermal Bonnor-Ebert spheres at T = 7 K and T = 20 K are plotted as black solid lines. The mass–size correlation observed for diffuse CO clumps (Elmegreen & Falgarone 1996) is displayed as a shaded yellow band. The blue curve marks a column density level corresponding to 5 × NH2,rms, where NH2,rms is the typical rms level of cirrus noise fluctuations at AV ~ 7 in the column density map (see Fig. B.4 and Eq. (B.1)). The arrow at the upper right indicates how the Herschel cores (and the blue curve marking the cirrus noise level) would move in the diagram using a distance of 415 pc instead of 260 pc (see Appendix C). (Color figure is available in the online version.)
Current usage metrics show cumulative count of Article Views (full-text article views including HTML views, PDF and ePub downloads, according to the available data) and Abstracts Views on Vision4Press platform.
Data correspond to usage on the plateform after 2015. The current usage metrics is available 48-96 hours after online publication and is updated daily on week days.
Initial download of the metrics may take a while.