Fig. 6
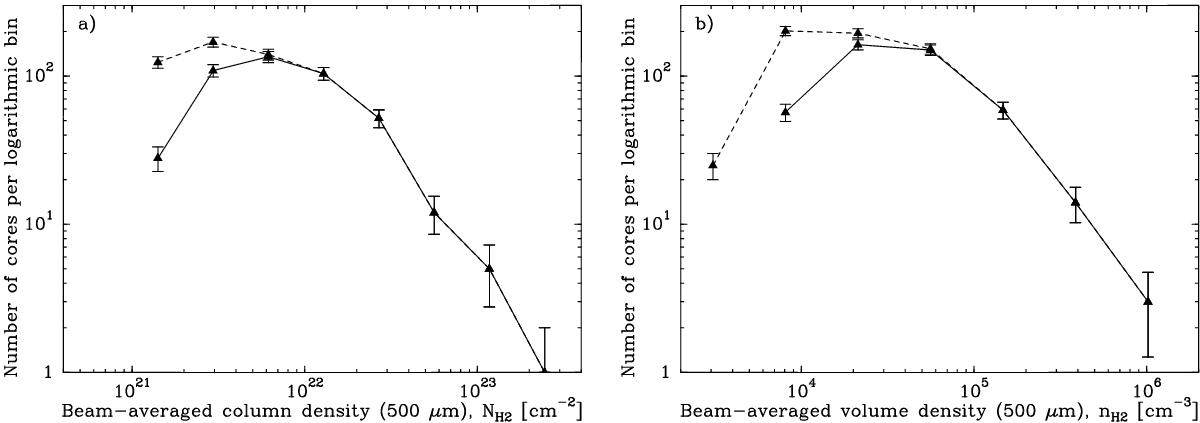
Distributions of beam-averaged column densities a) and beam-averaged volume densities b) at the resolution of the SPIRE 500 μm observations for the population of 446 candidate prestellar cores in Aquila (solid curves). In both panels, the dashed curves show the corresponding distributions for all 651 selected starless cores. (Color figure is available in the online version.)
Current usage metrics show cumulative count of Article Views (full-text article views including HTML views, PDF and ePub downloads, according to the available data) and Abstracts Views on Vision4Press platform.
Data correspond to usage on the plateform after 2015. The current usage metrics is available 48-96 hours after online publication and is updated daily on week days.
Initial download of the metrics may take a while.