Fig. 5
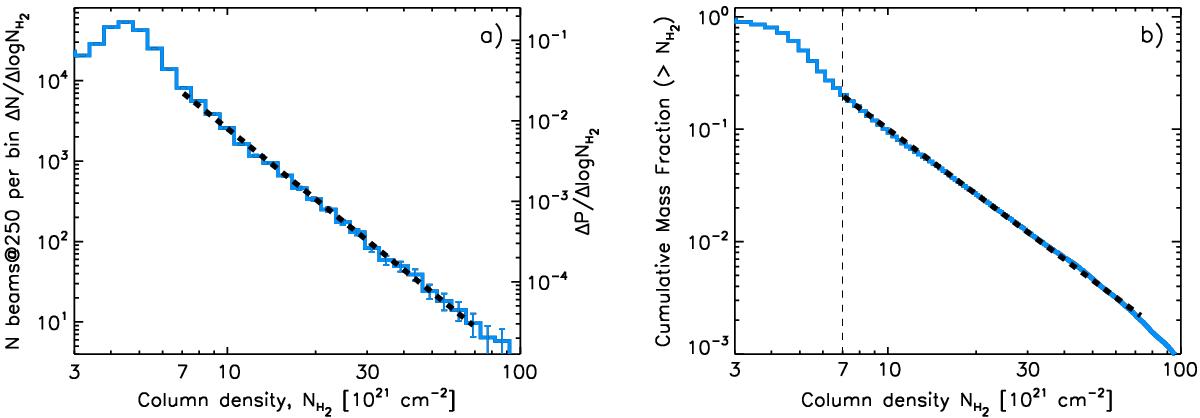
a) Probability density function of column density (N-PDF) in the Aquila cloud, derived from the 18.2′′-resolution column density image shown in Fig. 1. The left and right axes give the actual and normalized numbers of independent beams per logarithmic bin in the column density map, respectively. (The right axis thus provides an estimate of a proper N-PDF whose integral is 1.) A power-law fit to the high column density tail at AV> 7 gives dN/dlog![]() . The CO high-VLSR area in the eastern corner of the field (see Sect. 4.3) has been excluded from this PDF. b) Normalized cumulative mass fraction as a function of column density for the Aquila cloud (excluding the CO high-VLSR area – see Sect. 4.3), based on the Herschel column density map shown in Fig. 1. The dense material to the right of the dashed vertical line (equivalent to AV ~ 7–8) represents only ~17% of the total cloud mass, while the majority of the mass (~83%) corresponds to lower-density gas. A power-law fit to the cumulative mass fraction for AV> 7 gives
. The CO high-VLSR area in the eastern corner of the field (see Sect. 4.3) has been excluded from this PDF. b) Normalized cumulative mass fraction as a function of column density for the Aquila cloud (excluding the CO high-VLSR area – see Sect. 4.3), based on the Herschel column density map shown in Fig. 1. The dense material to the right of the dashed vertical line (equivalent to AV ~ 7–8) represents only ~17% of the total cloud mass, while the majority of the mass (~83%) corresponds to lower-density gas. A power-law fit to the cumulative mass fraction for AV> 7 gives ![]() . (Color figure is available in the online version.)
. (Color figure is available in the online version.)

Current usage metrics show cumulative count of Article Views (full-text article views including HTML views, PDF and ePub downloads, according to the available data) and Abstracts Views on Vision4Press platform.
Data correspond to usage on the plateform after 2015. The current usage metrics is available 48-96 hours after online publication and is updated daily on week days.
Initial download of the metrics may take a while.