Fig. 4
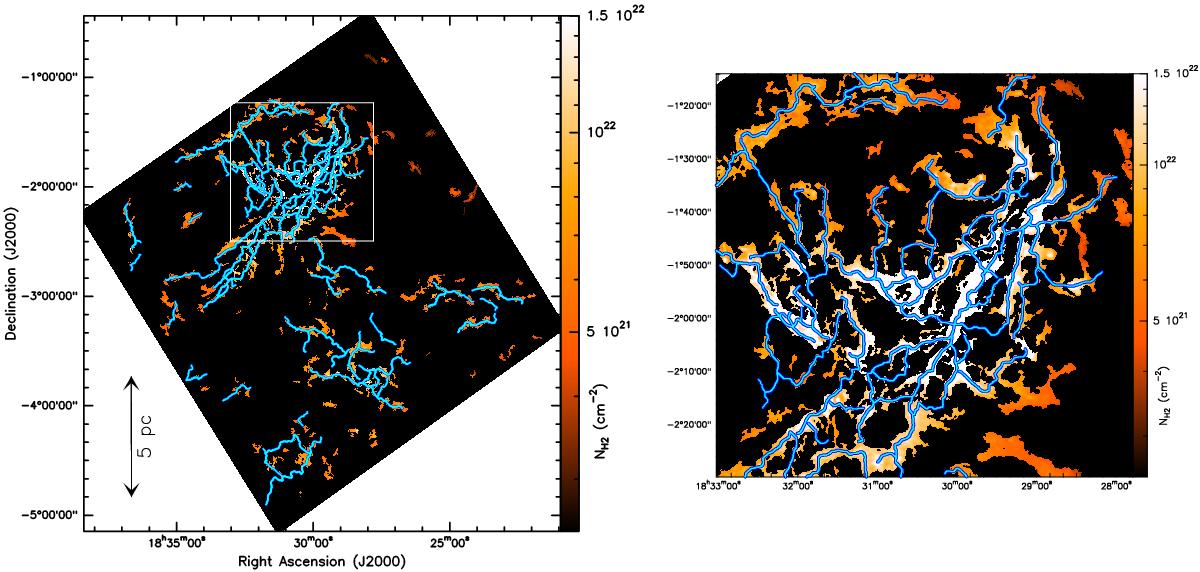
Left: mask of the filamentary network traced by getfilaments (Men’shchikov 2013) in the Herschel high-resolution column density map of the Aquila cloud complex. For better visualization, only angular scales up to 320″ (i.e., ~0.4 pc at d = 260 pc) are shown. The color scale displayed within the filamentary mask corresponds to column density values in the column density map (Fig. 1). The crests of the filaments traced by DisPerSE (Sousbie 2011) are overlaid in blue (see Sect. 4.2 for details). Right: blow-up of the subfield marked by the white square in the left panel, using the same color scale. (Color figure is available in the online version.)

Current usage metrics show cumulative count of Article Views (full-text article views including HTML views, PDF and ePub downloads, according to the available data) and Abstracts Views on Vision4Press platform.
Data correspond to usage on the plateform after 2015. The current usage metrics is available 48-96 hours after online publication and is updated daily on week days.
Initial download of the metrics may take a while.