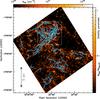
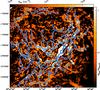
Fig. 3

Left: network of filaments in the Aquila cloud complex as traced by the curvelet transform component (cf. Starck et al. 2003) of the Herschel high-resolution column density map shown in Fig. 1. Given the typical filament width Wfil ~ 0.1 pc (see Arzoumanian et al. 2011 and Fig. 18) and the relation Mline ≈ Σ0 × Wfil between the central gas surface density Σ0 of a filament, this curvelet column density map provides information on the mass per unit length along the filaments (cf. André et al. 2010), as indicated by the color bar on the right. The white areas highlight regions of the map where Σ × Wfil exceeds half the critical mass per unit length ![]() (cf. Inutsuka & Miyama 1997) and the filaments are likely supercritical (Σ0 × Wfil>Mline,crit on the filament crest). The overplotted blue skeleton marks the crests of the filaments selected with the DisPerSE algorithm of Sousbie (2011) (see Sect. 4.2 for details). Right: blow-up of the Aquila main subfield marked by the white square in the left panel, using the same color scale. (Color figure is available in the online version.)
(cf. Inutsuka & Miyama 1997) and the filaments are likely supercritical (Σ0 × Wfil>Mline,crit on the filament crest). The overplotted blue skeleton marks the crests of the filaments selected with the DisPerSE algorithm of Sousbie (2011) (see Sect. 4.2 for details). Right: blow-up of the Aquila main subfield marked by the white square in the left panel, using the same color scale. (Color figure is available in the online version.)
Current usage metrics show cumulative count of Article Views (full-text article views including HTML views, PDF and ePub downloads, according to the available data) and Abstracts Views on Vision4Press platform.
Data correspond to usage on the plateform after 2015. The current usage metrics is available 48-96 hours after online publication and is updated daily on week days.
Initial download of the metrics may take a while.