Fig. B.4
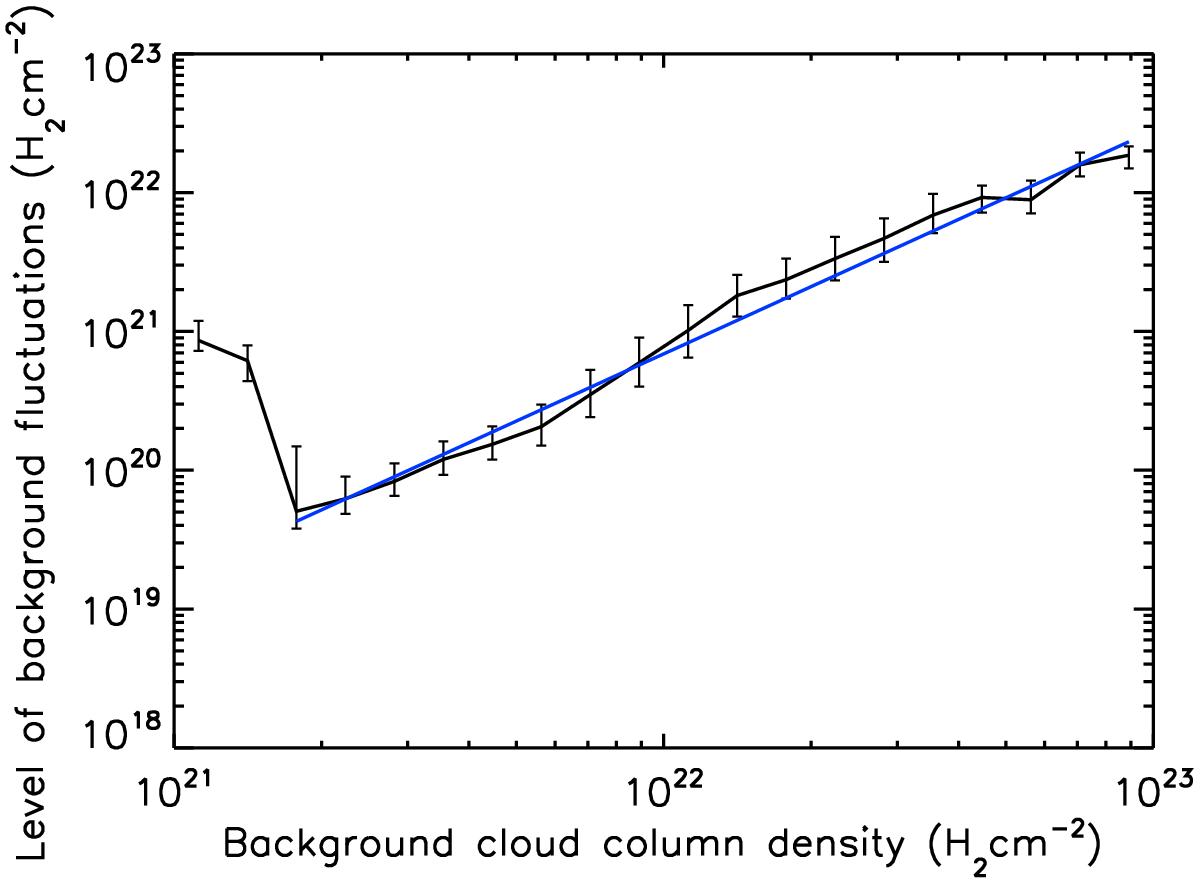
Median root mean square (rms) level of background column density fluctuations as a function of background cloud column density as measured in a 1′ × 1′ sliding box over the clean background image of the Aquila complex produced by getsources from the high-resolution column density map. The error bars correspond to the interquartile range of background fluctuations about the median level in each column density bin. The straight line represents a weighted power-law fit to the data points above NH2 ~ 2 × 1021 cm-2.
Current usage metrics show cumulative count of Article Views (full-text article views including HTML views, PDF and ePub downloads, according to the available data) and Abstracts Views on Vision4Press platform.
Data correspond to usage on the plateform after 2015. The current usage metrics is available 48-96 hours after online publication and is updated daily on week days.
Initial download of the metrics may take a while.