Fig. B.2
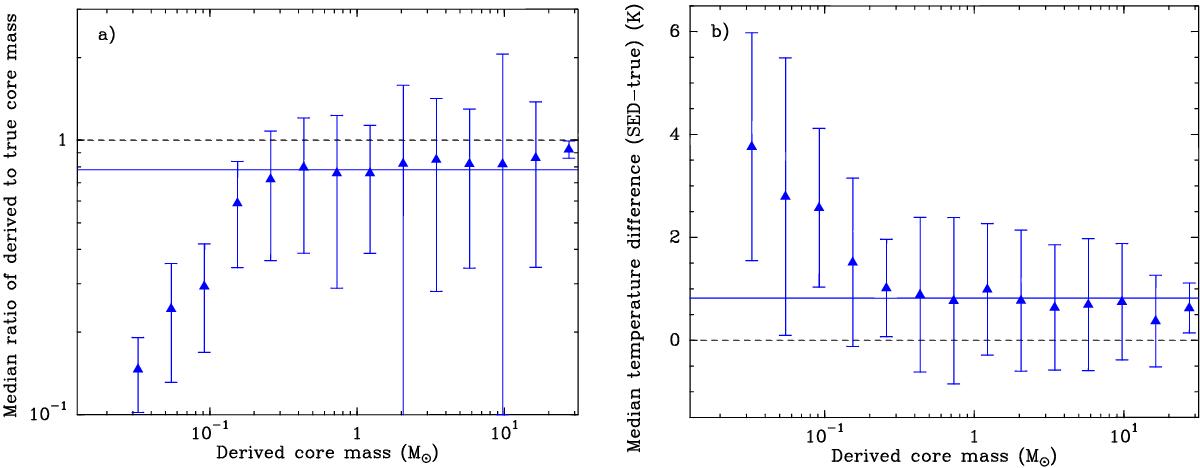
a) Ratio of derived to intrinsic (or “true”) core mass as a function of derived core mass for the same set of simulated core extractions as used in Appendix B.1 and Fig. B.1. The error bars are ± 1σ where σ is the dispersion of the mass ratio in each mass bin. The median mass ratio is ~ 0.8 above 0.4 M⊙ (as indicated by the horizontal blue line) and ~ 0.7 close to the 90% completeness limit of 0.2 M⊙ in observed core mass. The horizontal dashed line marks the mass ratio of 1 expected in the case of perfect core extractions and mass estimates. b) Difference between derived SED temperature and intrinsic mass-averaged dust temperature as a function of derived core mass for the same set of simulated core extractions. The error bars are ± 1σ where σ is the dispersion of the temperature difference in each mass bin. The median temperature difference is about + 0.8 K above 0.4 M⊙ (as indicated by the horizontal blue line) and ~ 1 K close to a derived core mass of 0.2 M⊙ (completeness limit). The horizontal dashed line marks the zero difference expected in the case of perfect core extractions and temperature estimates.
Current usage metrics show cumulative count of Article Views (full-text article views including HTML views, PDF and ePub downloads, according to the available data) and Abstracts Views on Vision4Press platform.
Data correspond to usage on the plateform after 2015. The current usage metrics is available 48-96 hours after online publication and is updated daily on week days.
Initial download of the metrics may take a while.