Fig. B.1
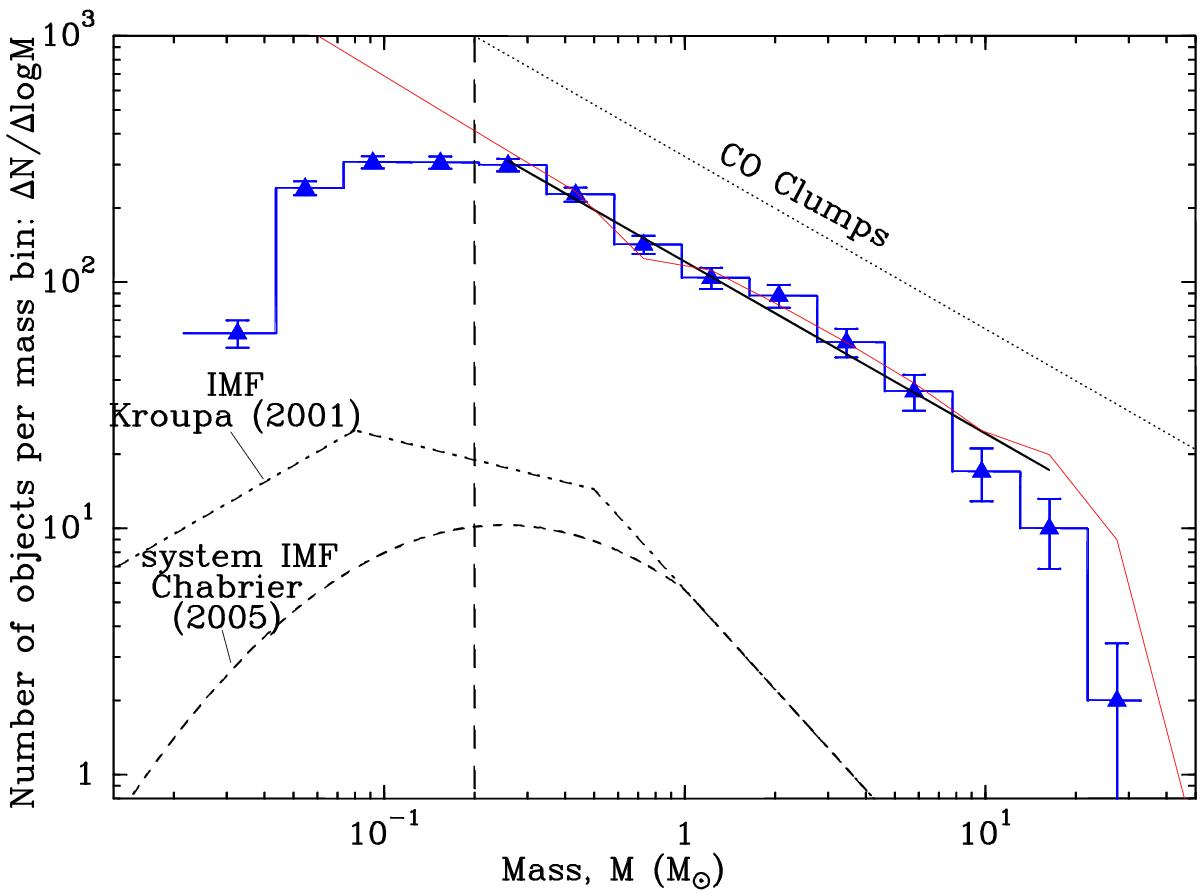
Synthetic core mass function (CMF) derived from simulated source extractions (blue histogram) compared to the input mass function (dN/dlogM ∝ M-0.7) of a population of 5622 model cores (red curve) constructed as described in Appendix B.1. The estimated 90% completeness level (in observed core mass) is indicated by the vertical dashed line at 0.2 M⊙. The black solid line shows a power-law fit to the derived CMF above the 0.2 M⊙ completeness level; it is in excellent agreement with the input core mass function. The drop of the synthetic CMF below the input CMF at the high-mass end is due to the fact that the derived core masses tend to underestimate the true core masses by ~ 20% on average (see Fig. B.2a).
Current usage metrics show cumulative count of Article Views (full-text article views including HTML views, PDF and ePub downloads, according to the available data) and Abstracts Views on Vision4Press platform.
Data correspond to usage on the plateform after 2015. The current usage metrics is available 48-96 hours after online publication and is updated daily on week days.
Initial download of the metrics may take a while.