Fig. A.3
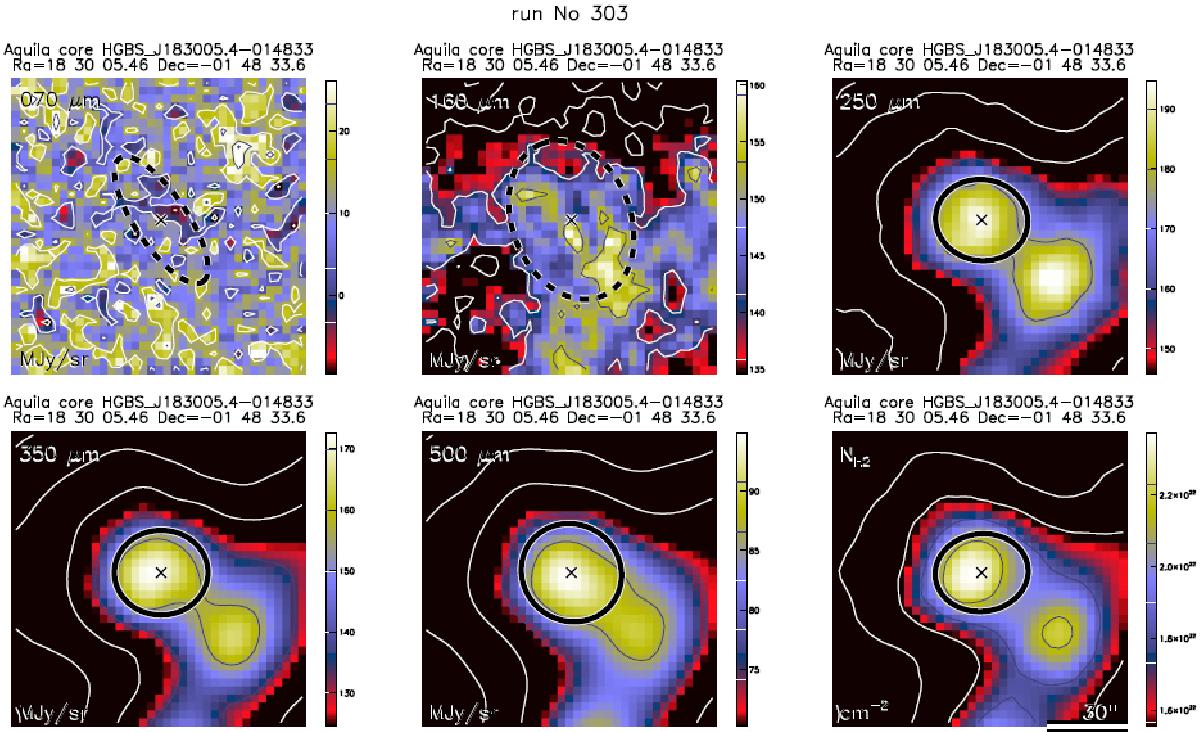
Example blow-up Herschel images at 70/160/250/350/500 μm and high-resolution column density map for a (bound) prestellar core. Ellipses represent the estimated major and minor FWHM sizes of the core at each wavelength; they are shown as solid or dashed curves depending on whether the core is significantly detected or not, respectively, at a particular wavelength. See Table A.2 for the physical radius of the core and other derived properties. An angular scale of 30″ (i.e., ~ 0.038 pc at d = 260 pc) is shown at the bottom right. North is up, east is left. Similar image cutouts are provided on http://gouldbelt-herschel.cea.fr/archives for all selected starless cores.
Current usage metrics show cumulative count of Article Views (full-text article views including HTML views, PDF and ePub downloads, according to the available data) and Abstracts Views on Vision4Press platform.
Data correspond to usage on the plateform after 2015. The current usage metrics is available 48-96 hours after online publication and is updated daily on week days.
Initial download of the metrics may take a while.