Fig. A.2
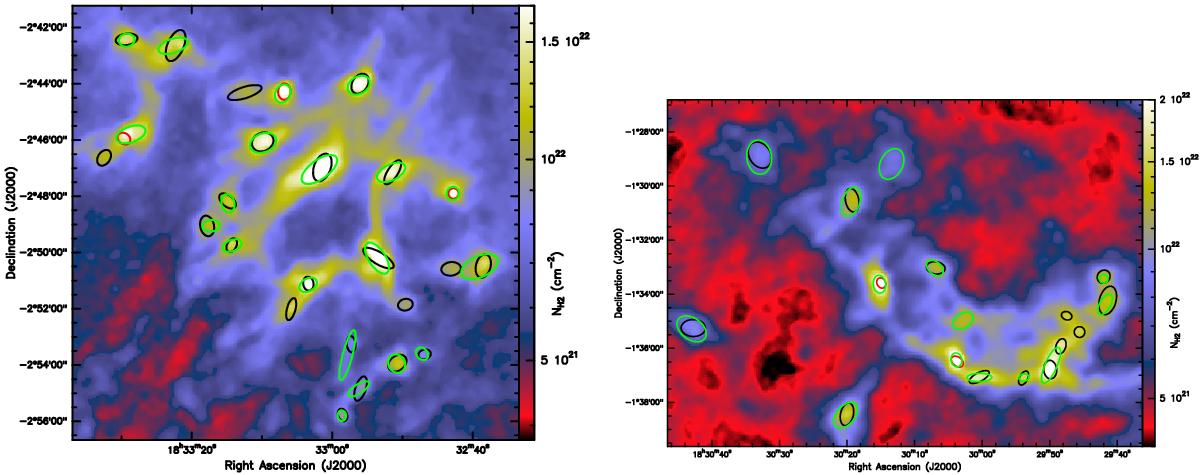
Blow-up column density images of two Aquila subfields at 18.2″ resolution. Black and red ellipses mark the FWHM sizes of the starless cores and protostellar cores, respectively, selected from getsources extractions in these two subfields. Green ellipses show the FWHM sizes of the sources independently detected with CSAR (Kirk et al. 2013b) in the high-resolution column density image.
Current usage metrics show cumulative count of Article Views (full-text article views including HTML views, PDF and ePub downloads, according to the available data) and Abstracts Views on Vision4Press platform.
Data correspond to usage on the plateform after 2015. The current usage metrics is available 48-96 hours after online publication and is updated daily on week days.
Initial download of the metrics may take a while.