Free Access
Fig. 2
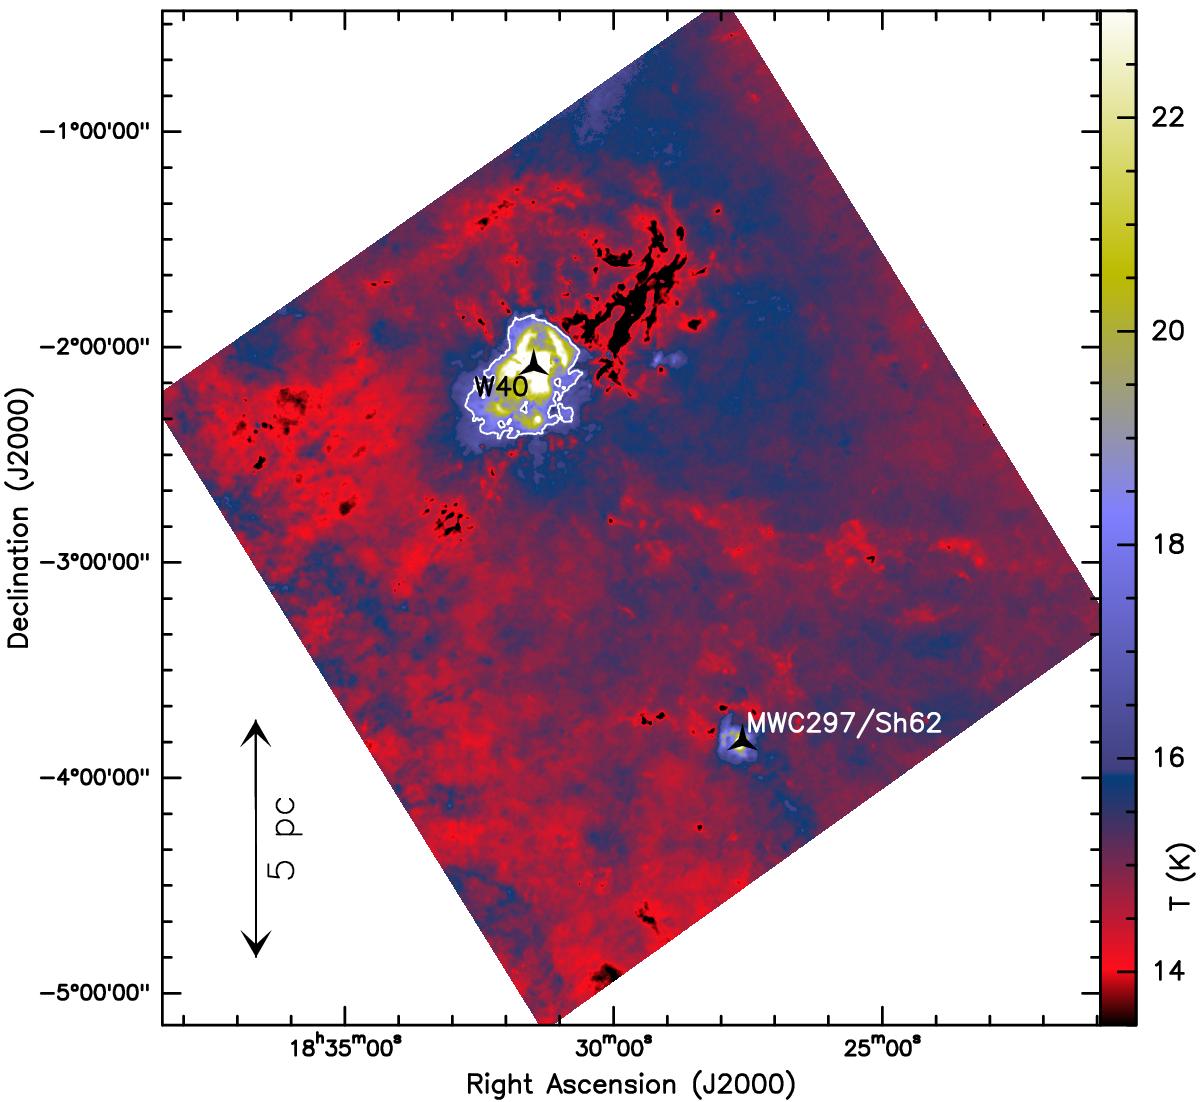
Dust temperature map of the Aquila region at 36.3′′resolution, as derived from HGBS data (see Sect. 4.1). The white contour outlines the W40 HII region which has Td> 17 K. (Color figure is available in the online version.)
Current usage metrics show cumulative count of Article Views (full-text article views including HTML views, PDF and ePub downloads, according to the available data) and Abstracts Views on Vision4Press platform.
Data correspond to usage on the plateform after 2015. The current usage metrics is available 48-96 hours after online publication and is updated daily on week days.
Initial download of the metrics may take a while.